
Analysis dashboard
New dashboard and a re-design of the analysis module
The analysis is now accessed from the new button bottom right on the hitlist.
Equally when you are in the analysis module you can quickly switch back to the hitlist view using the equivalent button displayed bottom right on each chart.
Key facts: Dashboard
When you click Analyze you will now land directly on a dashboard.
From here you can access individual charts by clicking on any of the dashboard charts (icon top right on mouse over, or hyper link on the key stats). Or by clicking on the tab “Single view”.
There are two versions of the dashboard:
- - Company dashboard. When your analysis is concentrated on one main company, the dashboard highlights their partners and their different strengths in the different key technical domains.
- - Technology dashboard. When your analysis contains many different companies, the dashboard highlights these companies and their different relative strengths.
Chart menu
From a Single view chart, you access other charts using the new chart menu which contains 4 sections:
- - Recommended visualizations. A recommendation of key charts suggested by Questel.
- - All visualizations. All of the main charts organized by data type : Year, Assignee, Inventor, Technology, Legal status.
- - Favorite visualizations. Charts which you have saved for future use (this was previously called MyCharts).
- - Switch chart type. Allows you to keep the same data but switch the chart type.
The settings menu still exists and this is where you should go to tweak the details of any of the main charts. For instance; changing from CPC group display to CPC code display is done from the settings menu.
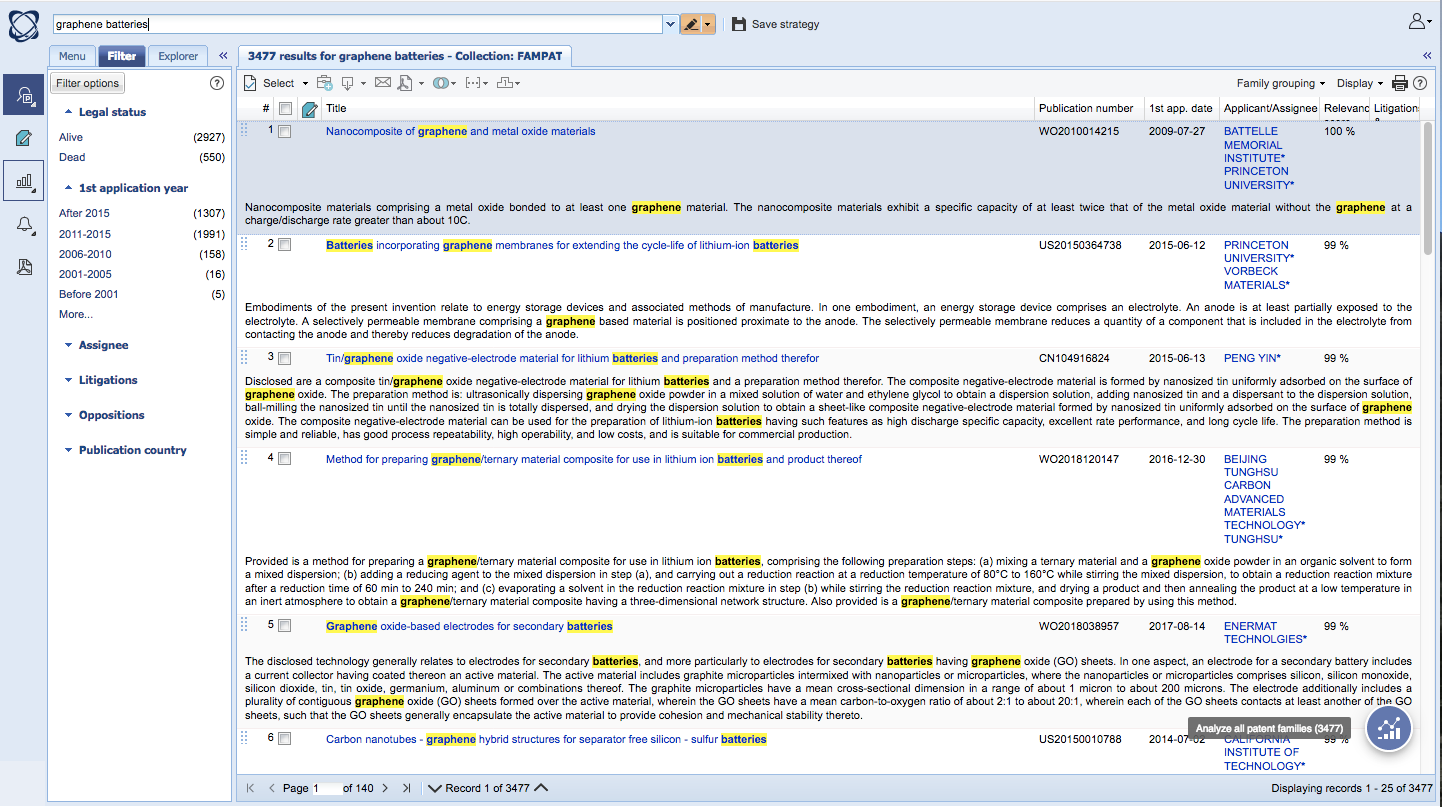
Access the analysis module by selecting the analysis icon at the bottom right corner.
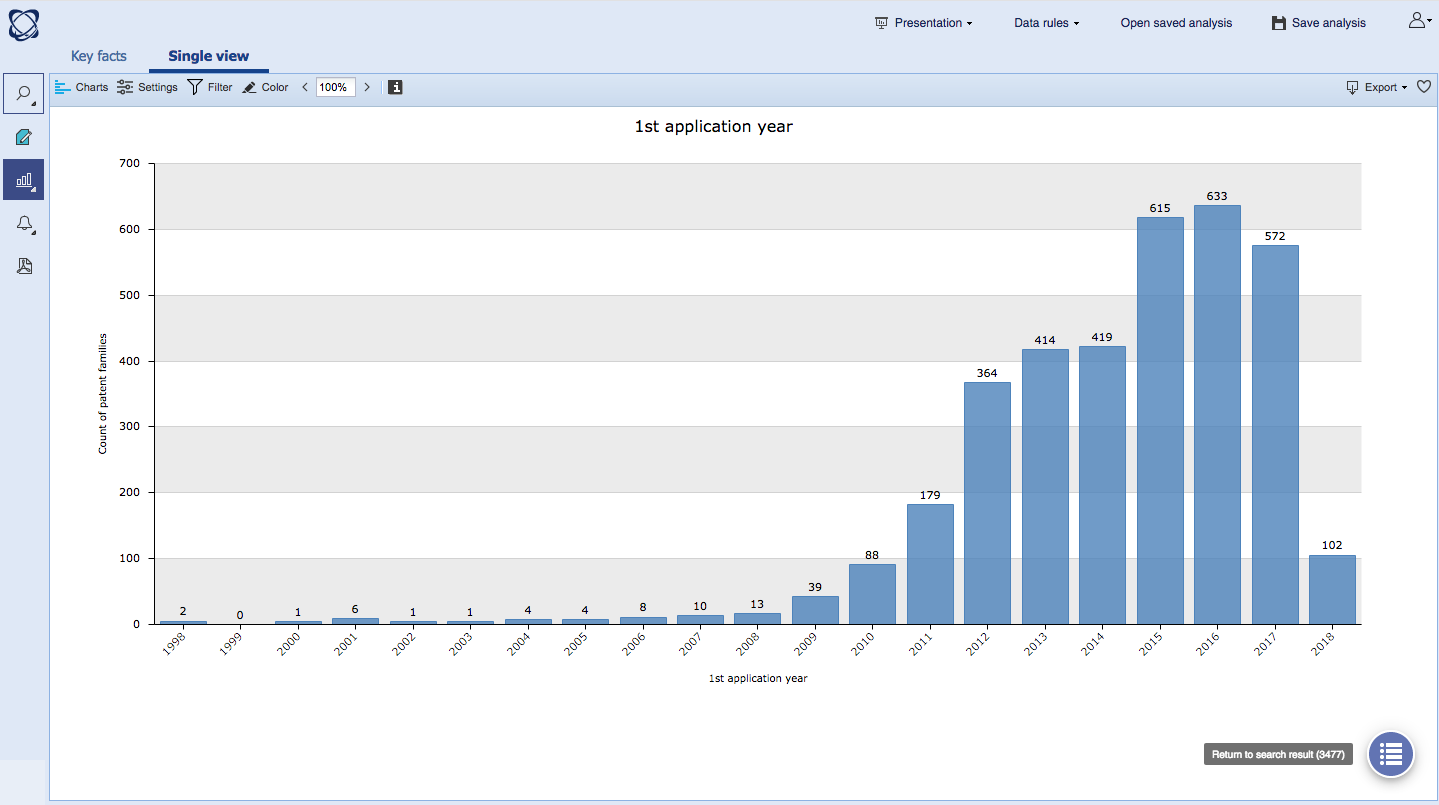
You can quickly switch back to your results using the hitlist icon at the bottom right of each chart.
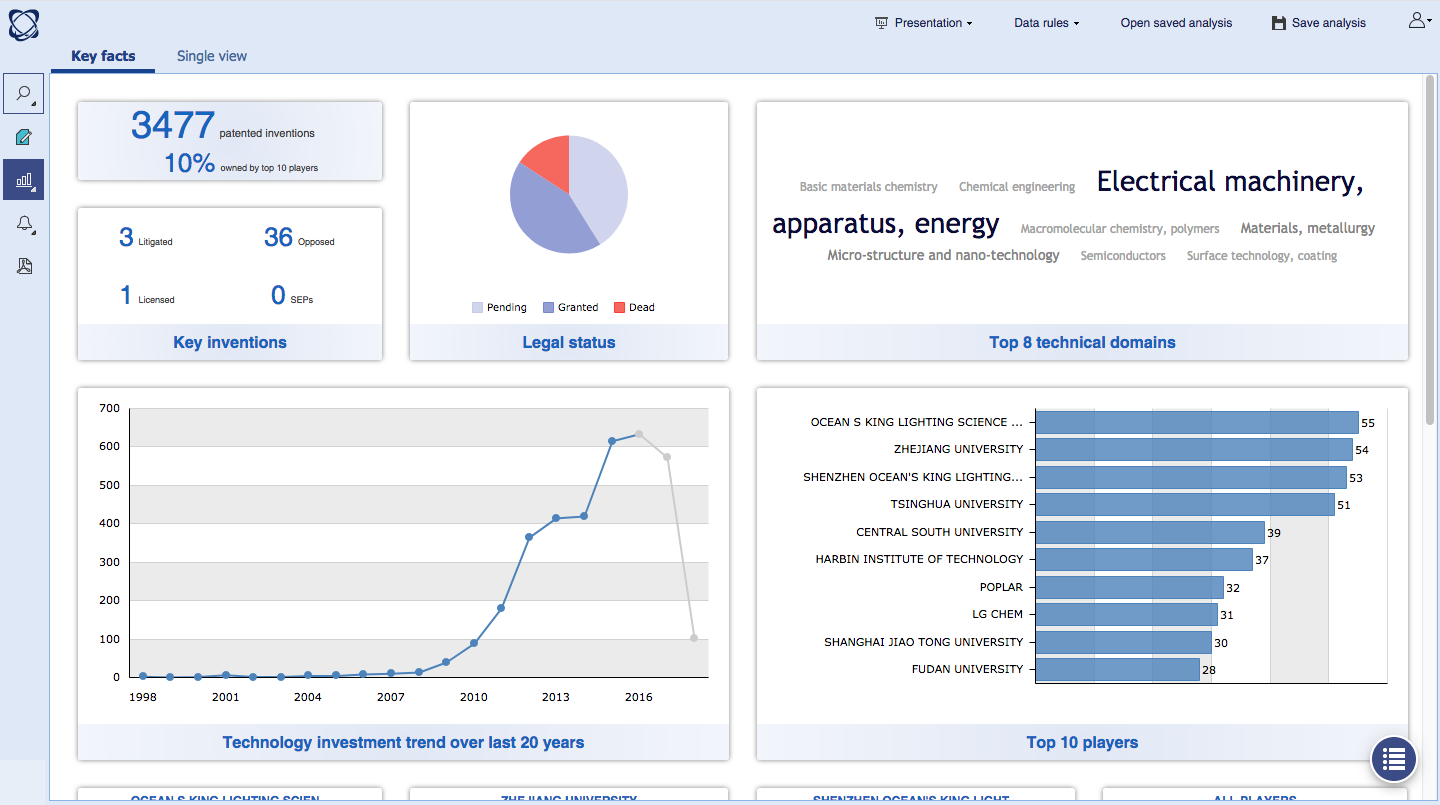
Key facts dashboard: the new landing page for the analysis module. From here you can access individual charts by clicking on any of the dashboard charts (icon top right on mouse over, or hyper link on the key stats). Or by clicking on the tab “Single view”.
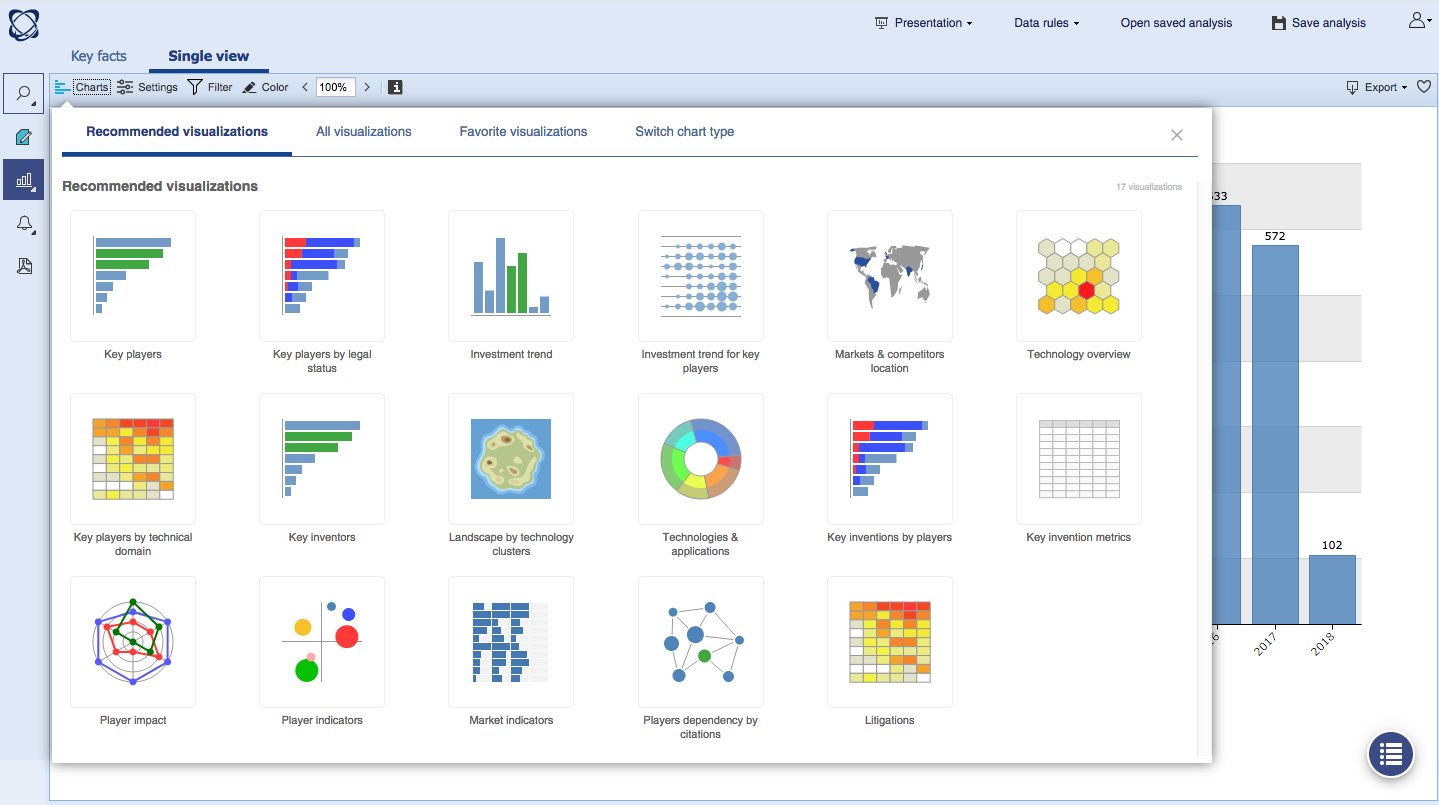
The new “Chart” menu, next to the settings menu is the new quick way to choose your next chart.