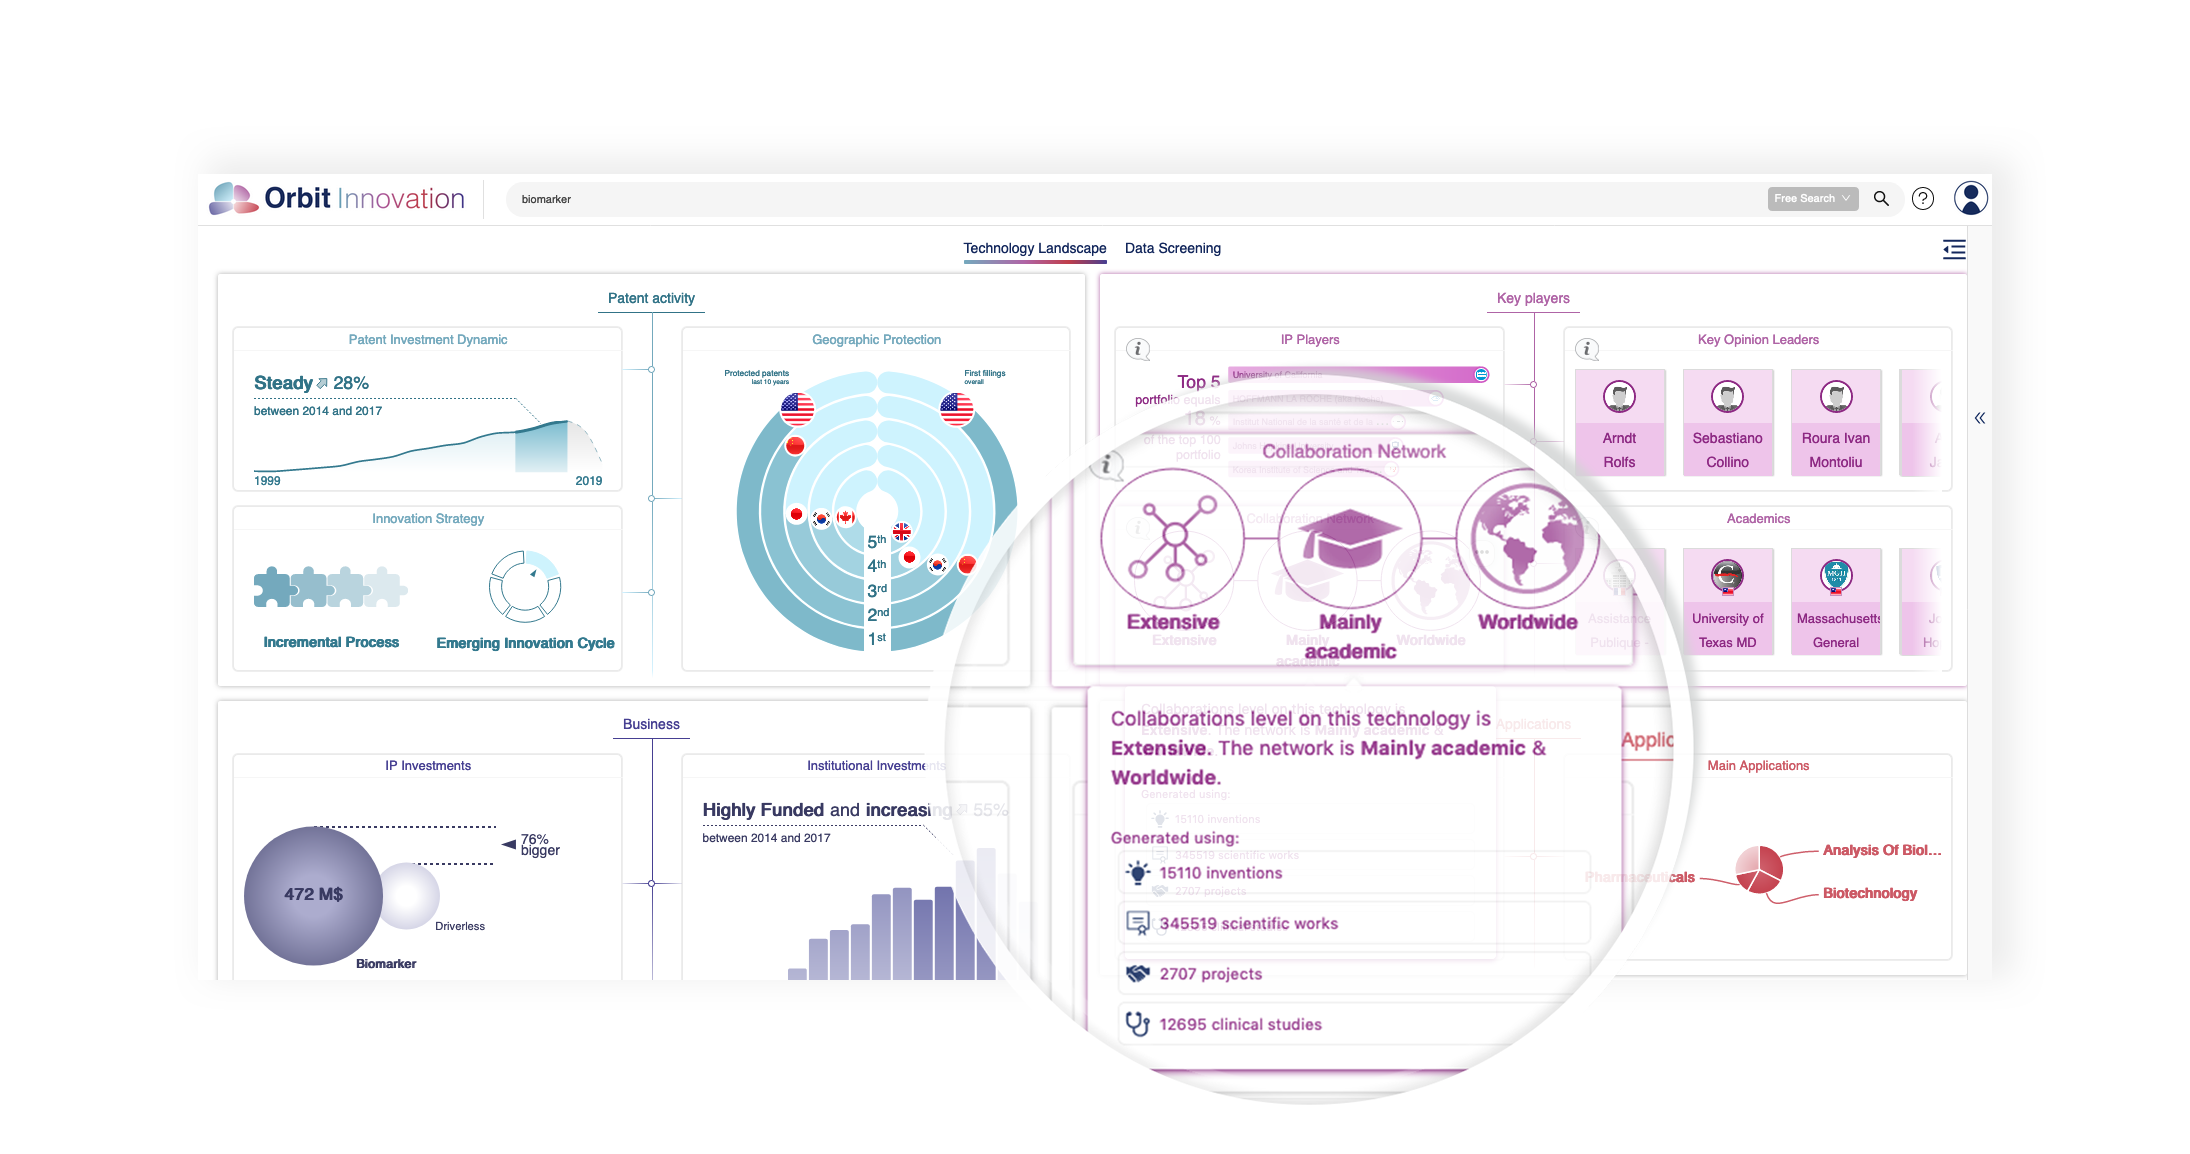
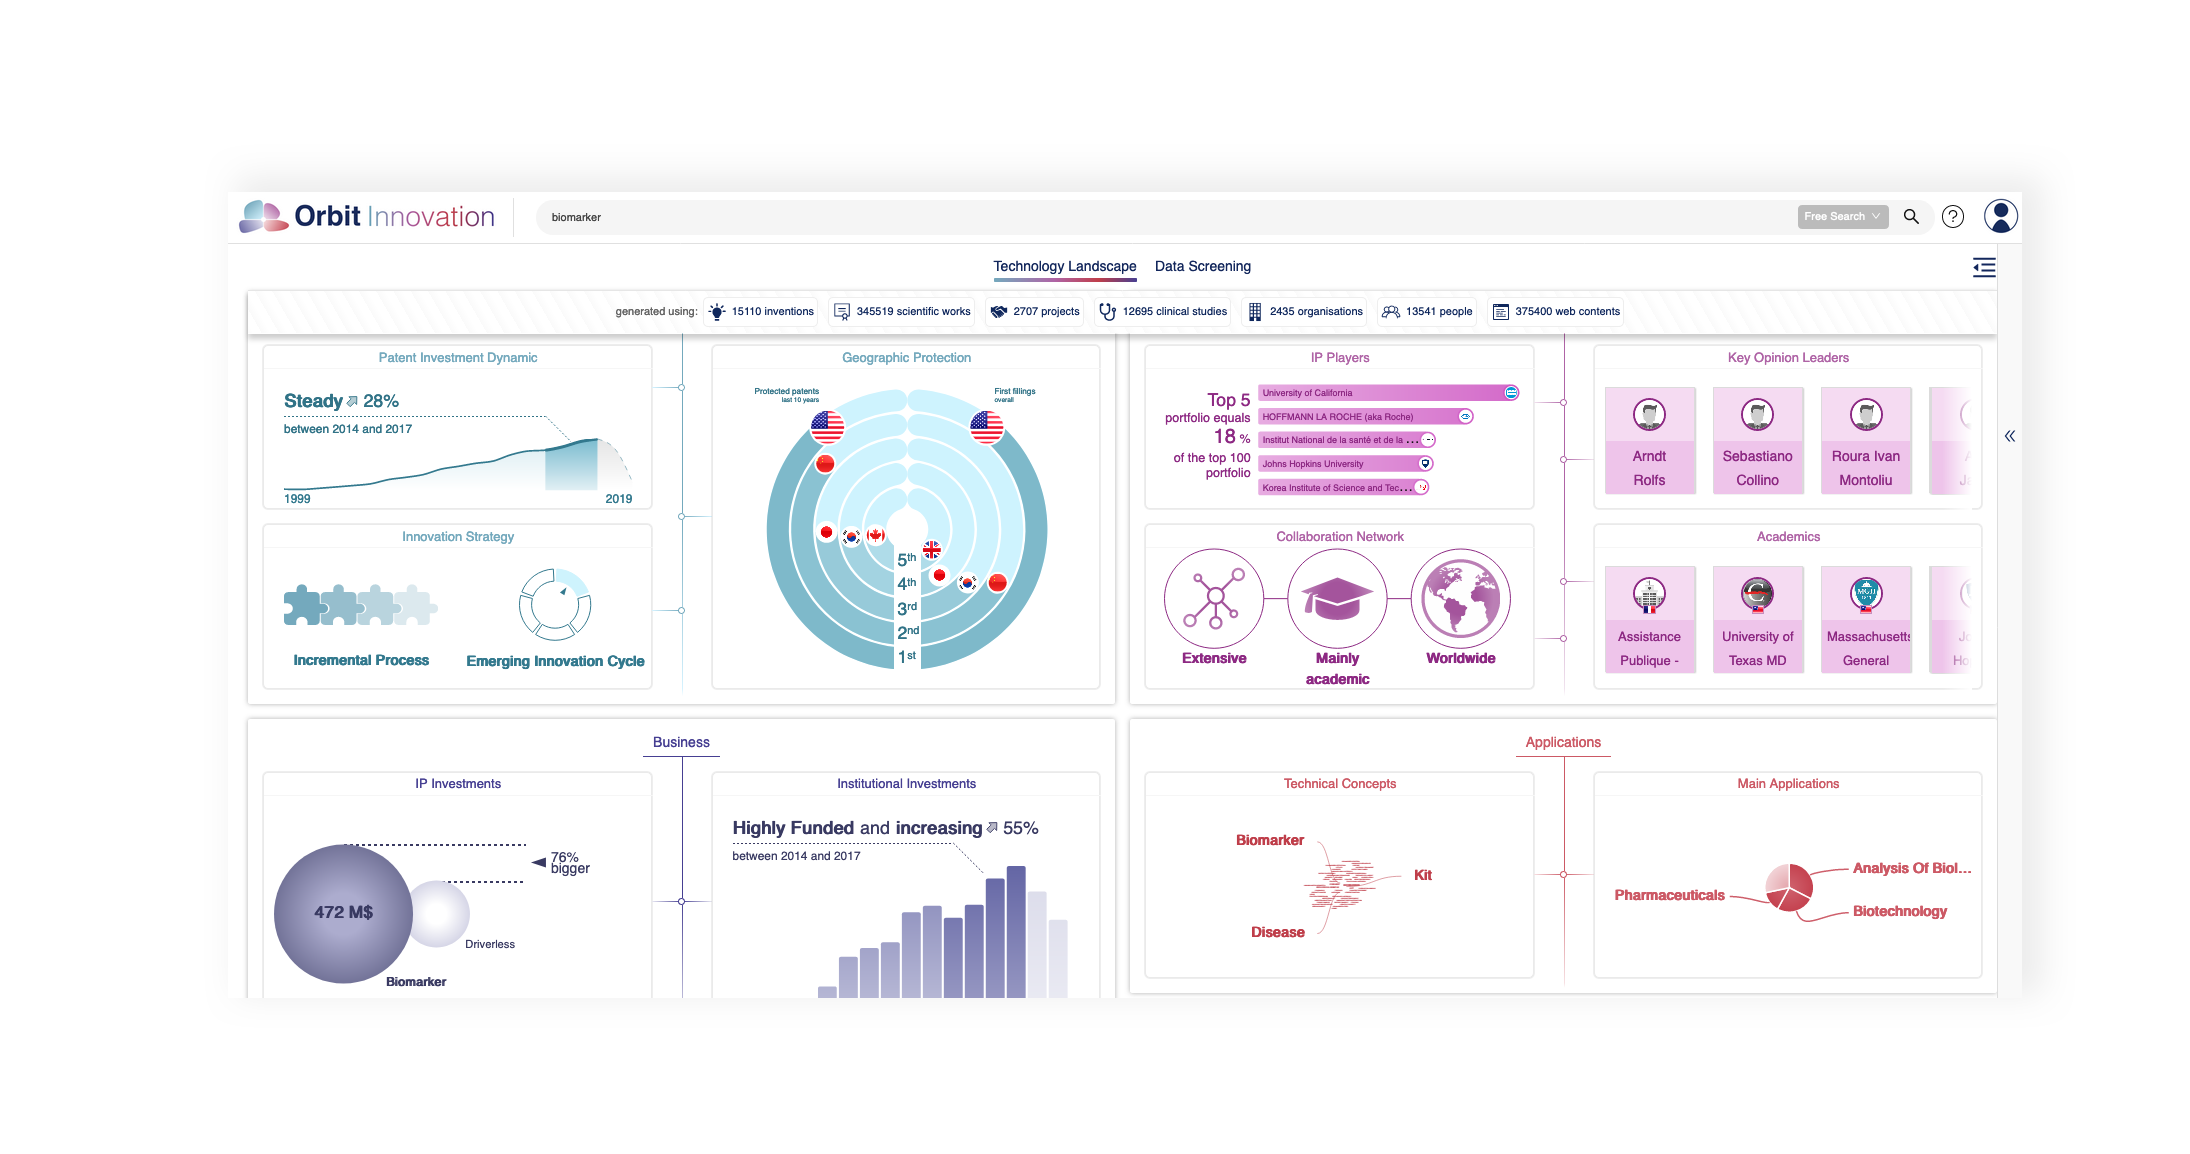
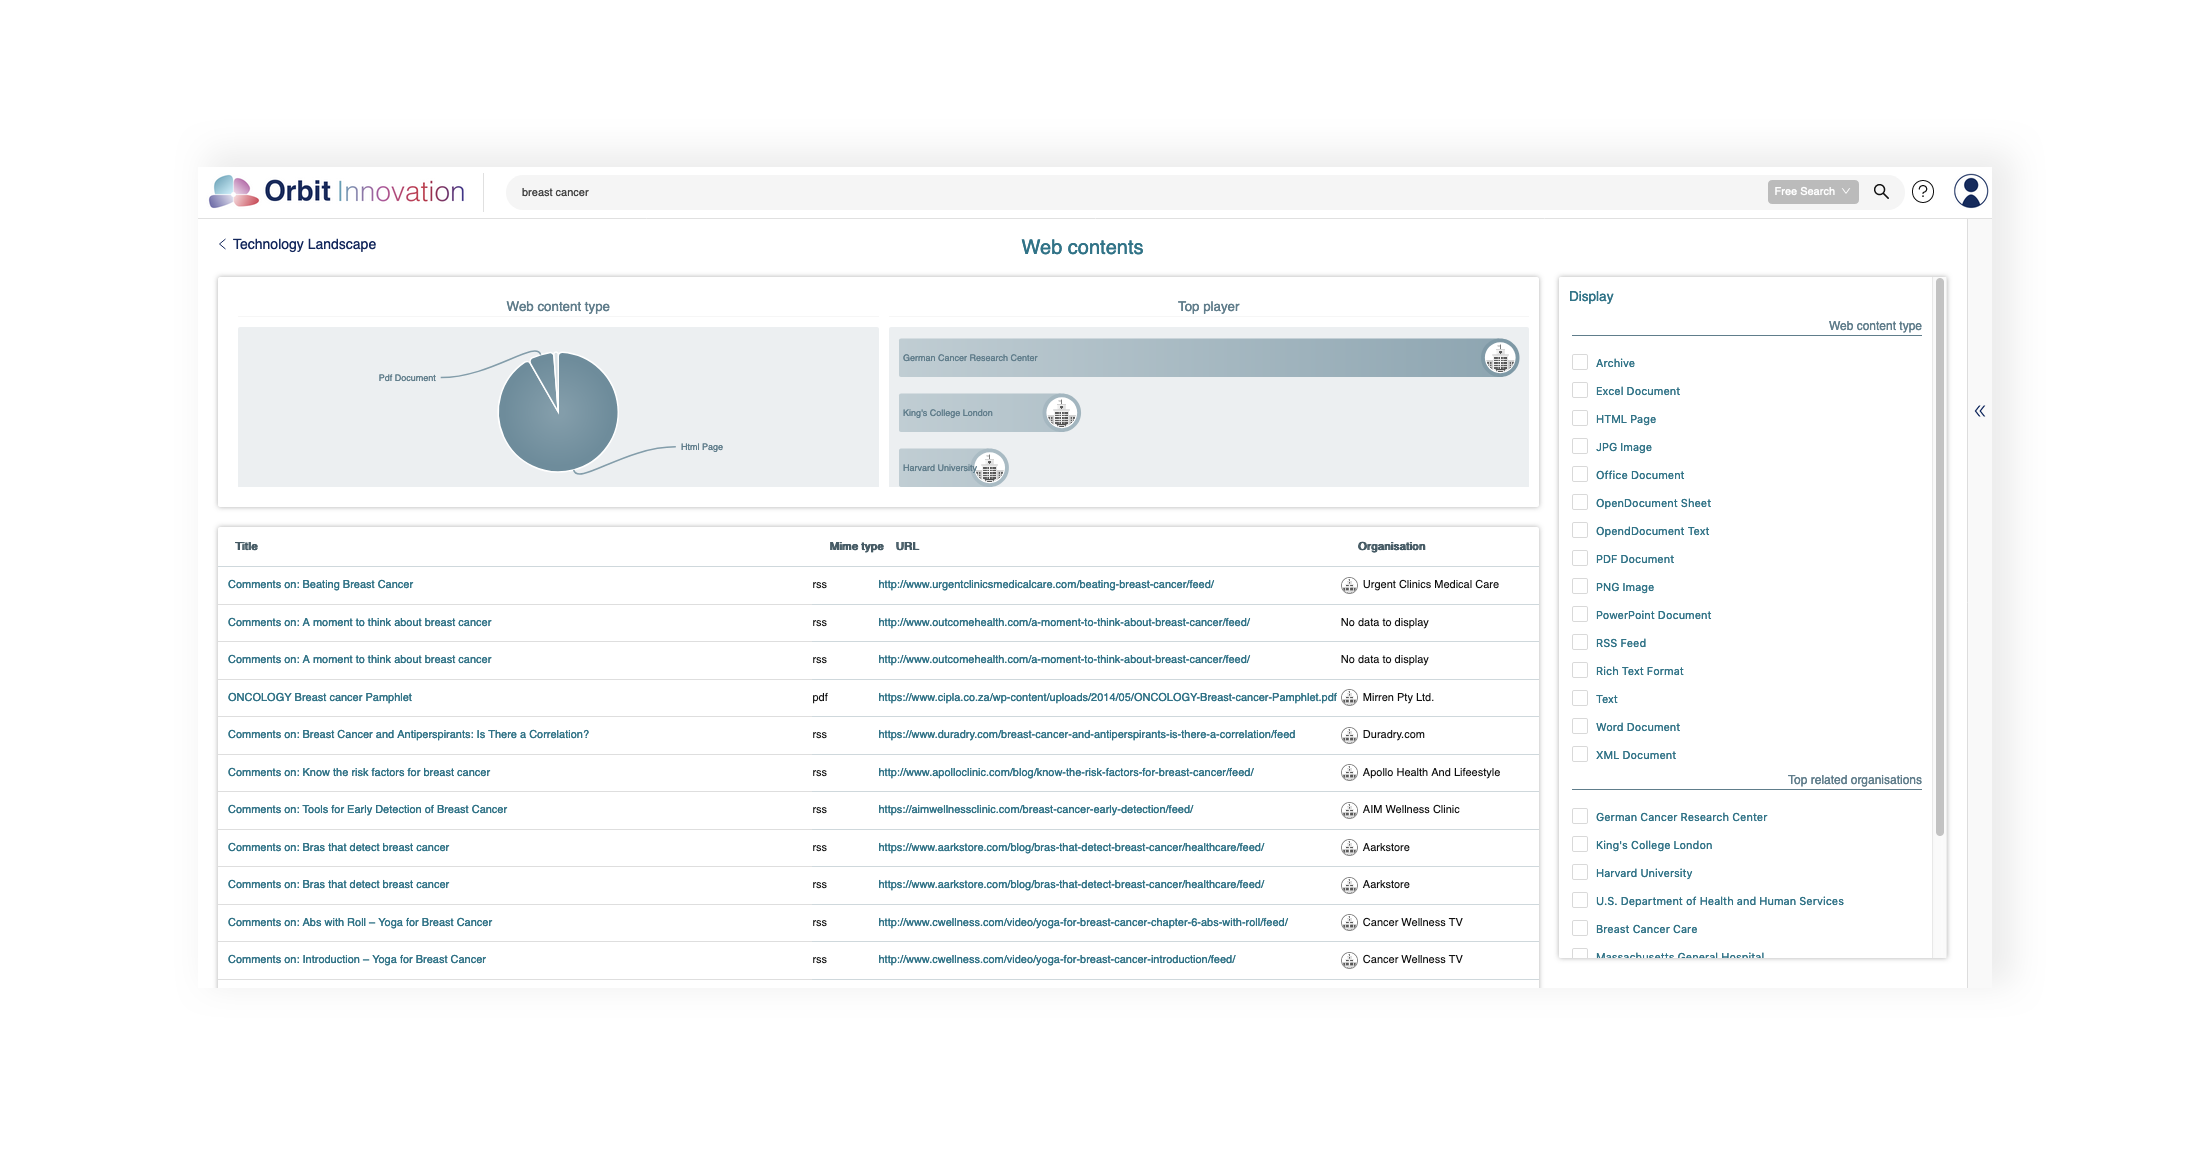
Instantly access statistics of analyzed sources
All statistics on analyzed sources are now available from the dashboards.
The statistics banner at the top of the page provides the volumes and types of data used to generate the dashboards. Simply click on each item to open the data listings and access the documents.
By simply hovering your mouse over a metric, you can also quickly visualize the volume and type of data used to generate each graph.