Metrics available in the Live analysis
Would you buy a car if you had only been informed about one of its characteristics? Sure, it does 0-60 in 3 seconds but? Does it run of gas, electric or hybrid? What's its safety rating? Does it have space for 3 kids plus luggage?
You can draw parallels with a detailed patent landscape, it's great to know how many patent families each company has but it's also critical to understand how well protected those families are and what the impact of those families have been. We can do this using metrics like forward citations count, family size and geographic coverage.
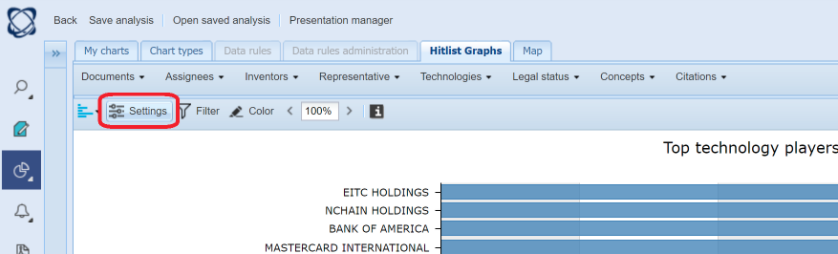
Up until now these metrics have been available in the saved analysis but not in the live environment. Now 50% of the metrics are directly available in the live analysis, in the Settings menu.
Metrics which are now available in the live analysis
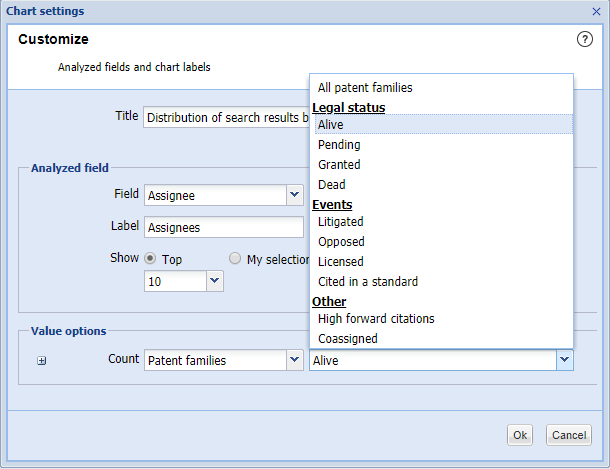
Patent family-based metrics
Legal status
- Alive patent family count
- Pending patent family count
- Granted patent family count
- Dead patent family count
Events
- Litigated patent family count
- Opposed patent family count
- Licensed patent family count
- Count of patents cited in standards
Other
- Count of patents with exceptionally high citation count
- Count of co-assigneed patent families
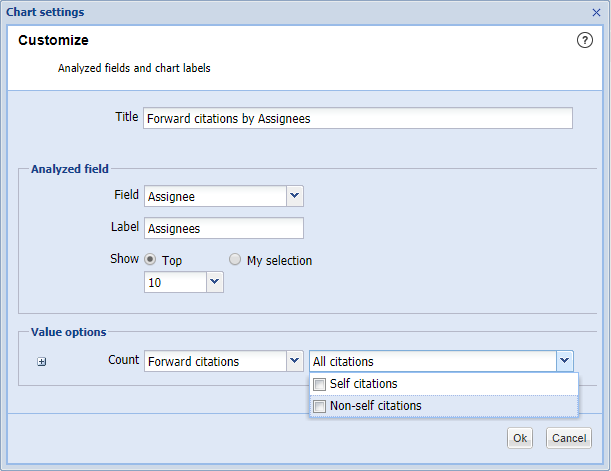
Forward citation metrics
- Count of all citations
- Count of non-self-citations
- Count of self-citations
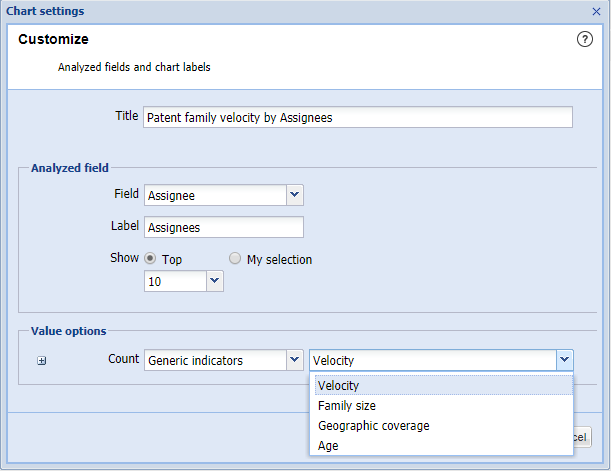
Generic indicators
- Velocity
- Family size
- Geographic coverage
- Age
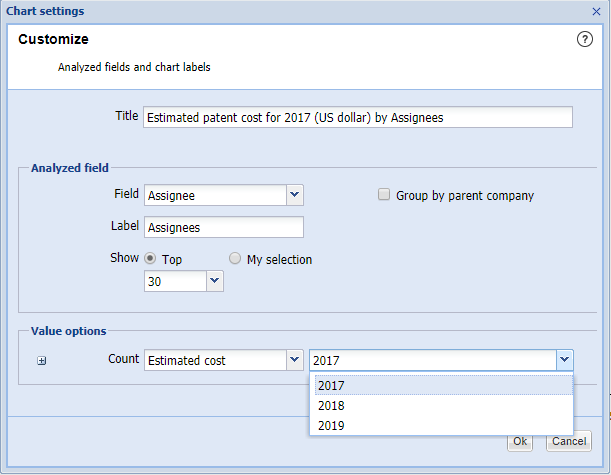
Cost metrics
- Estimated patent expenditure 2017
- Estimated patent expenditure 2018
- Estimated patent expenditure 2019
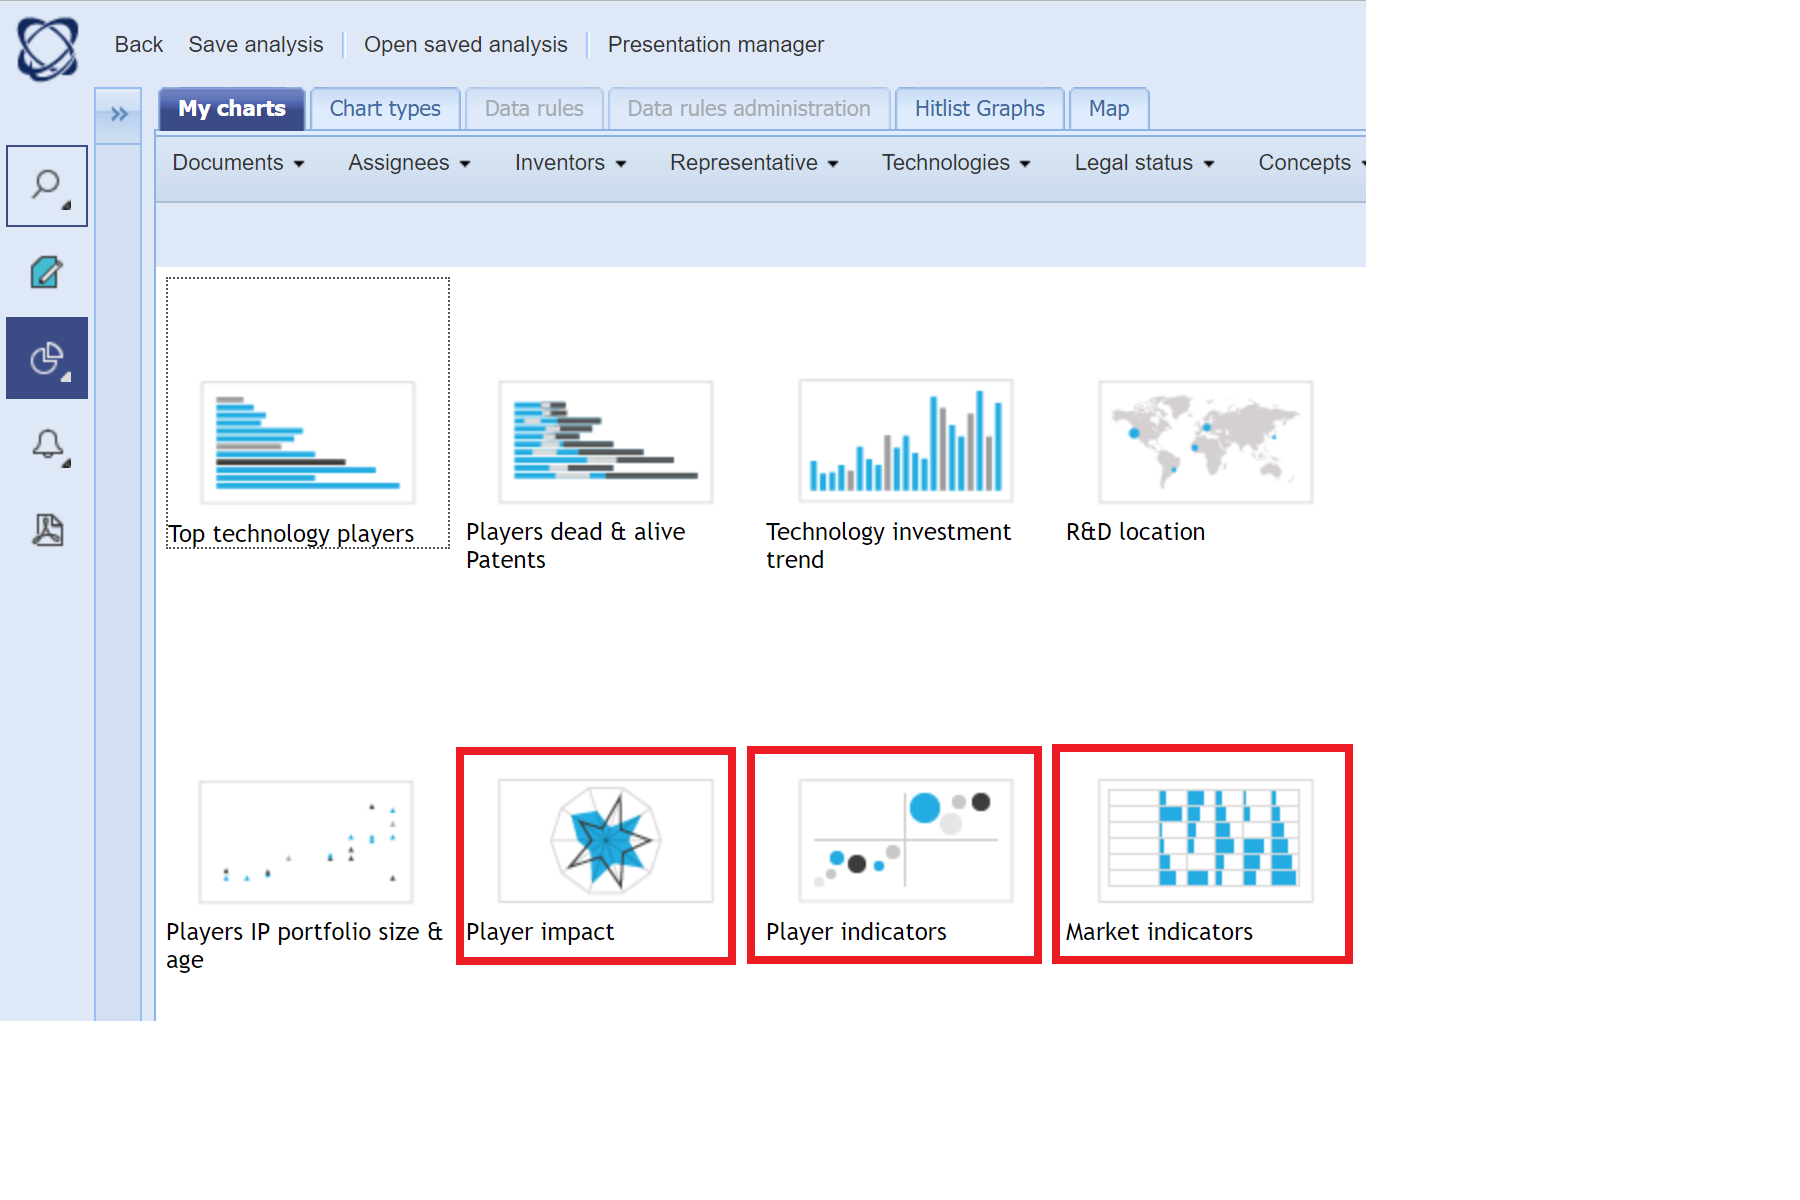
New Charts which are now available in the live analysis:
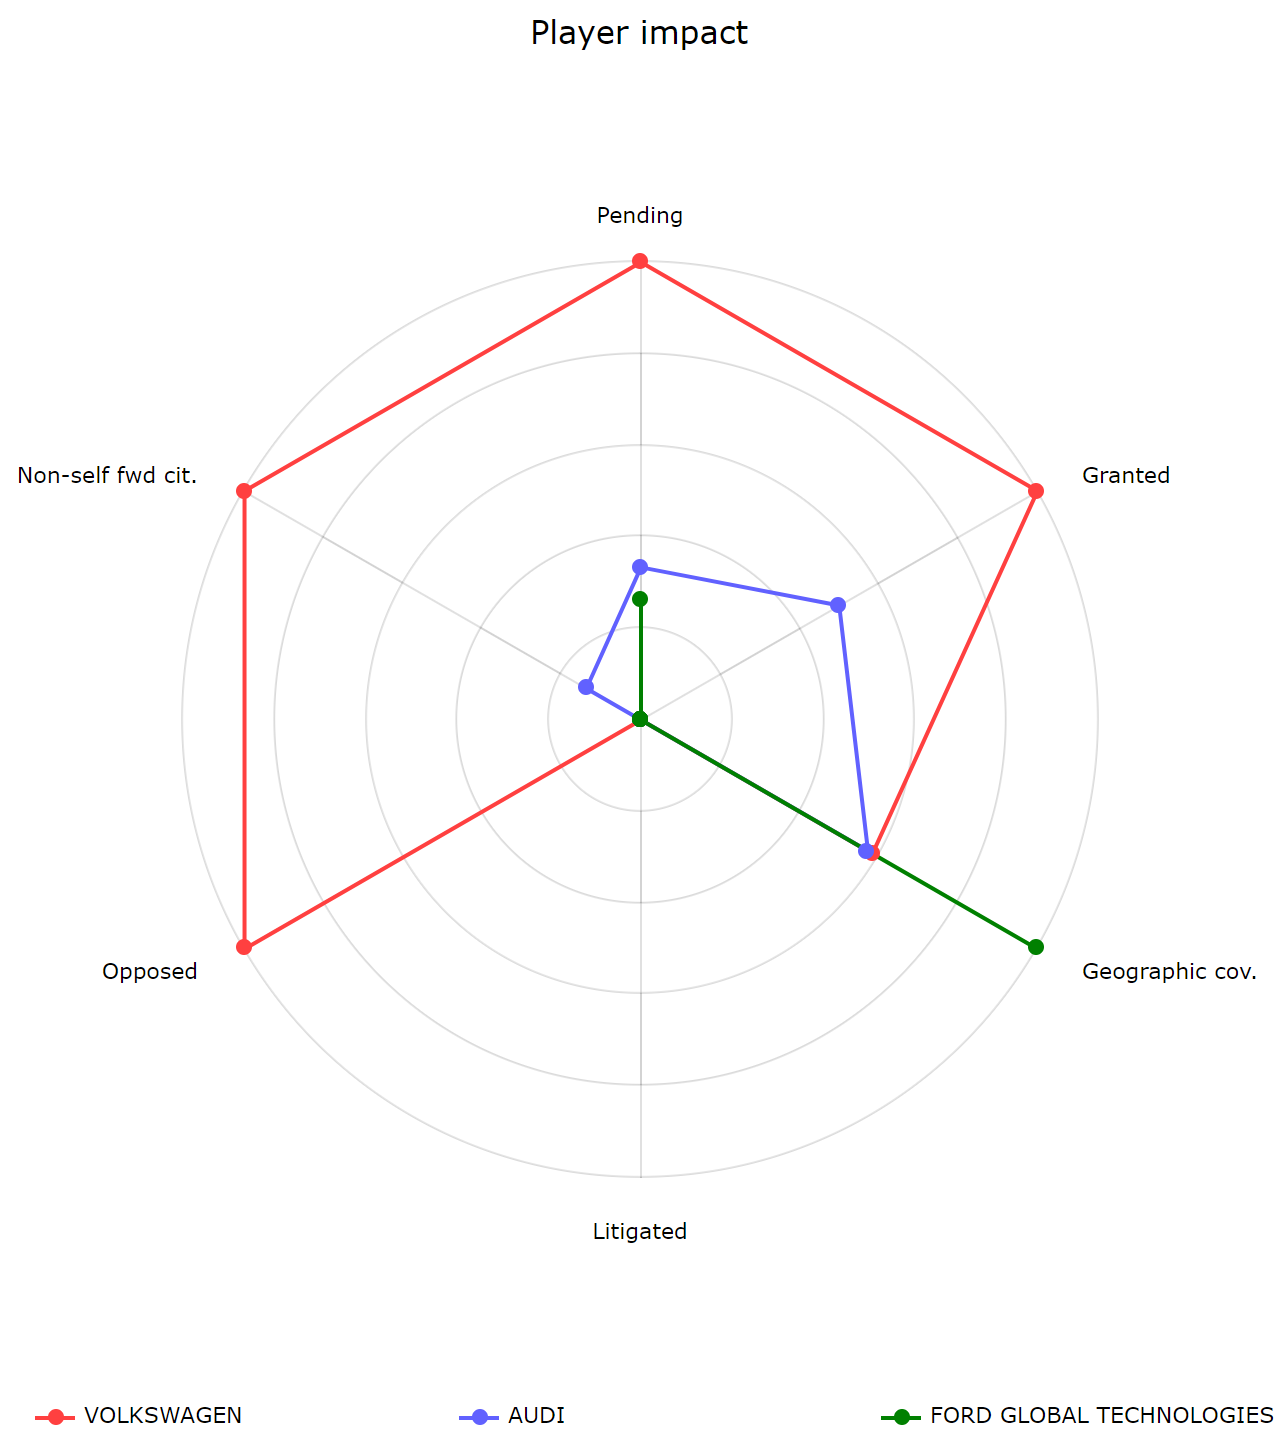
- Radar chart
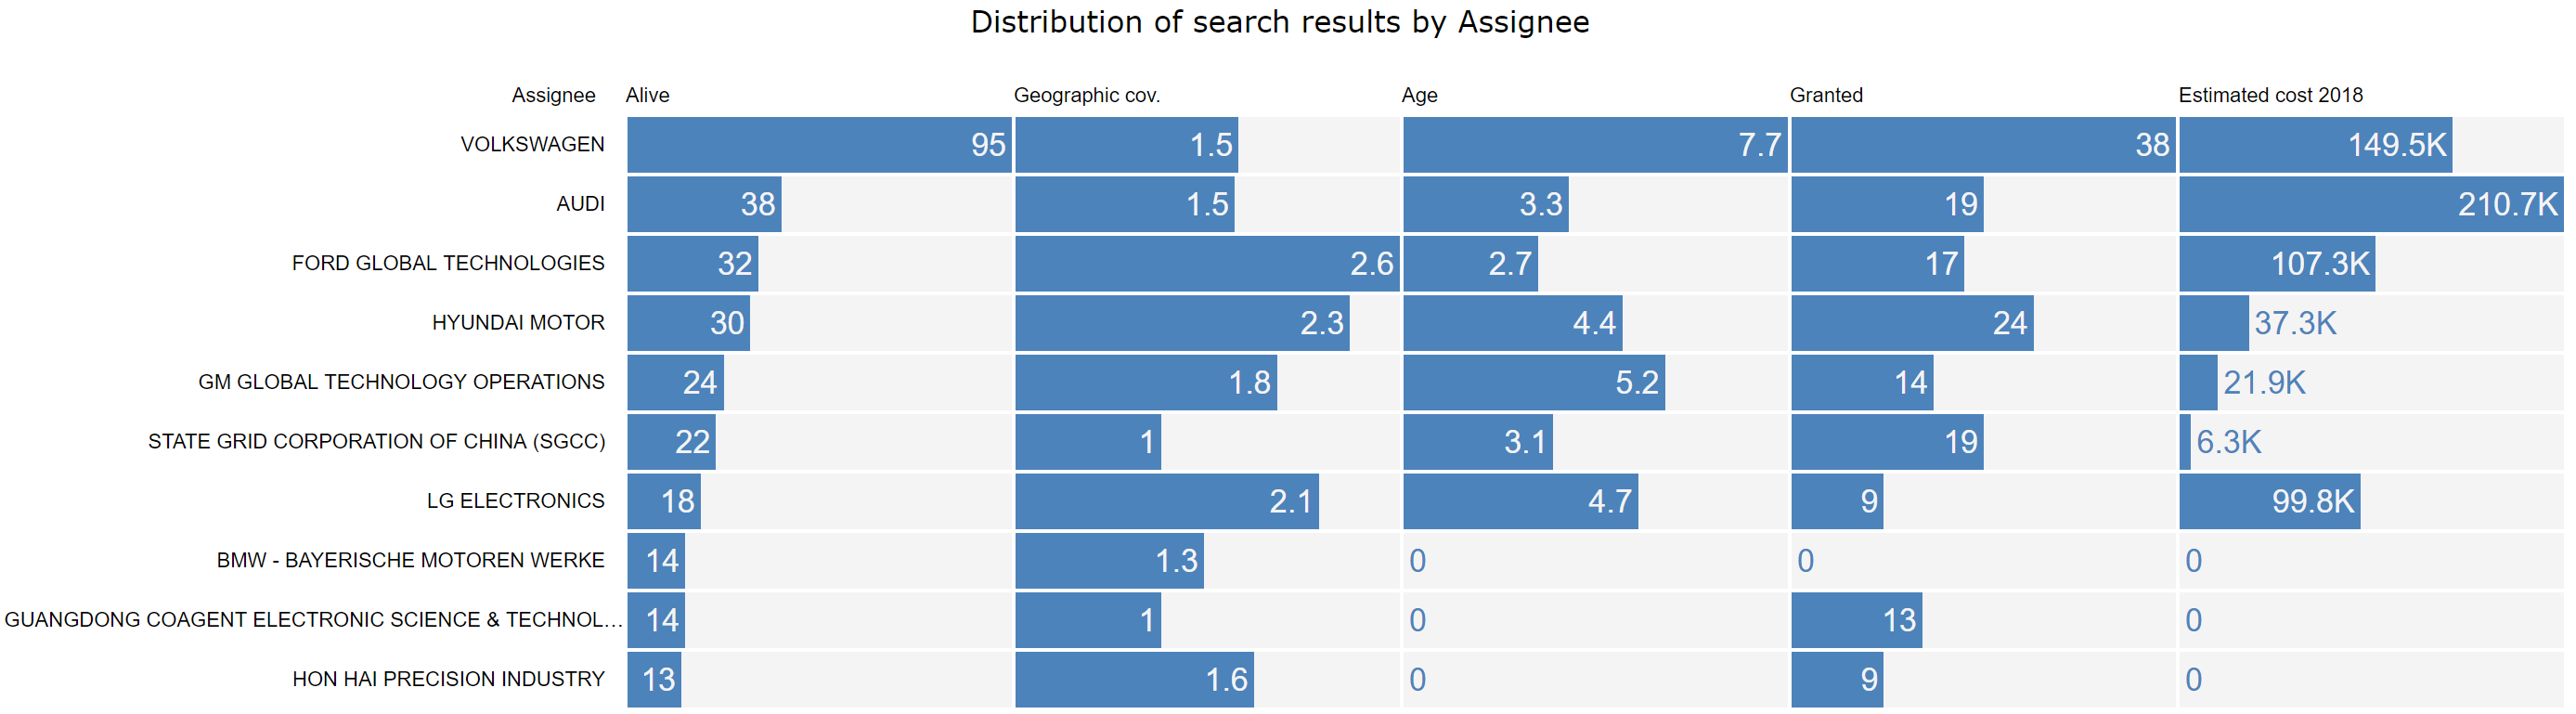
- Tabular bar chart
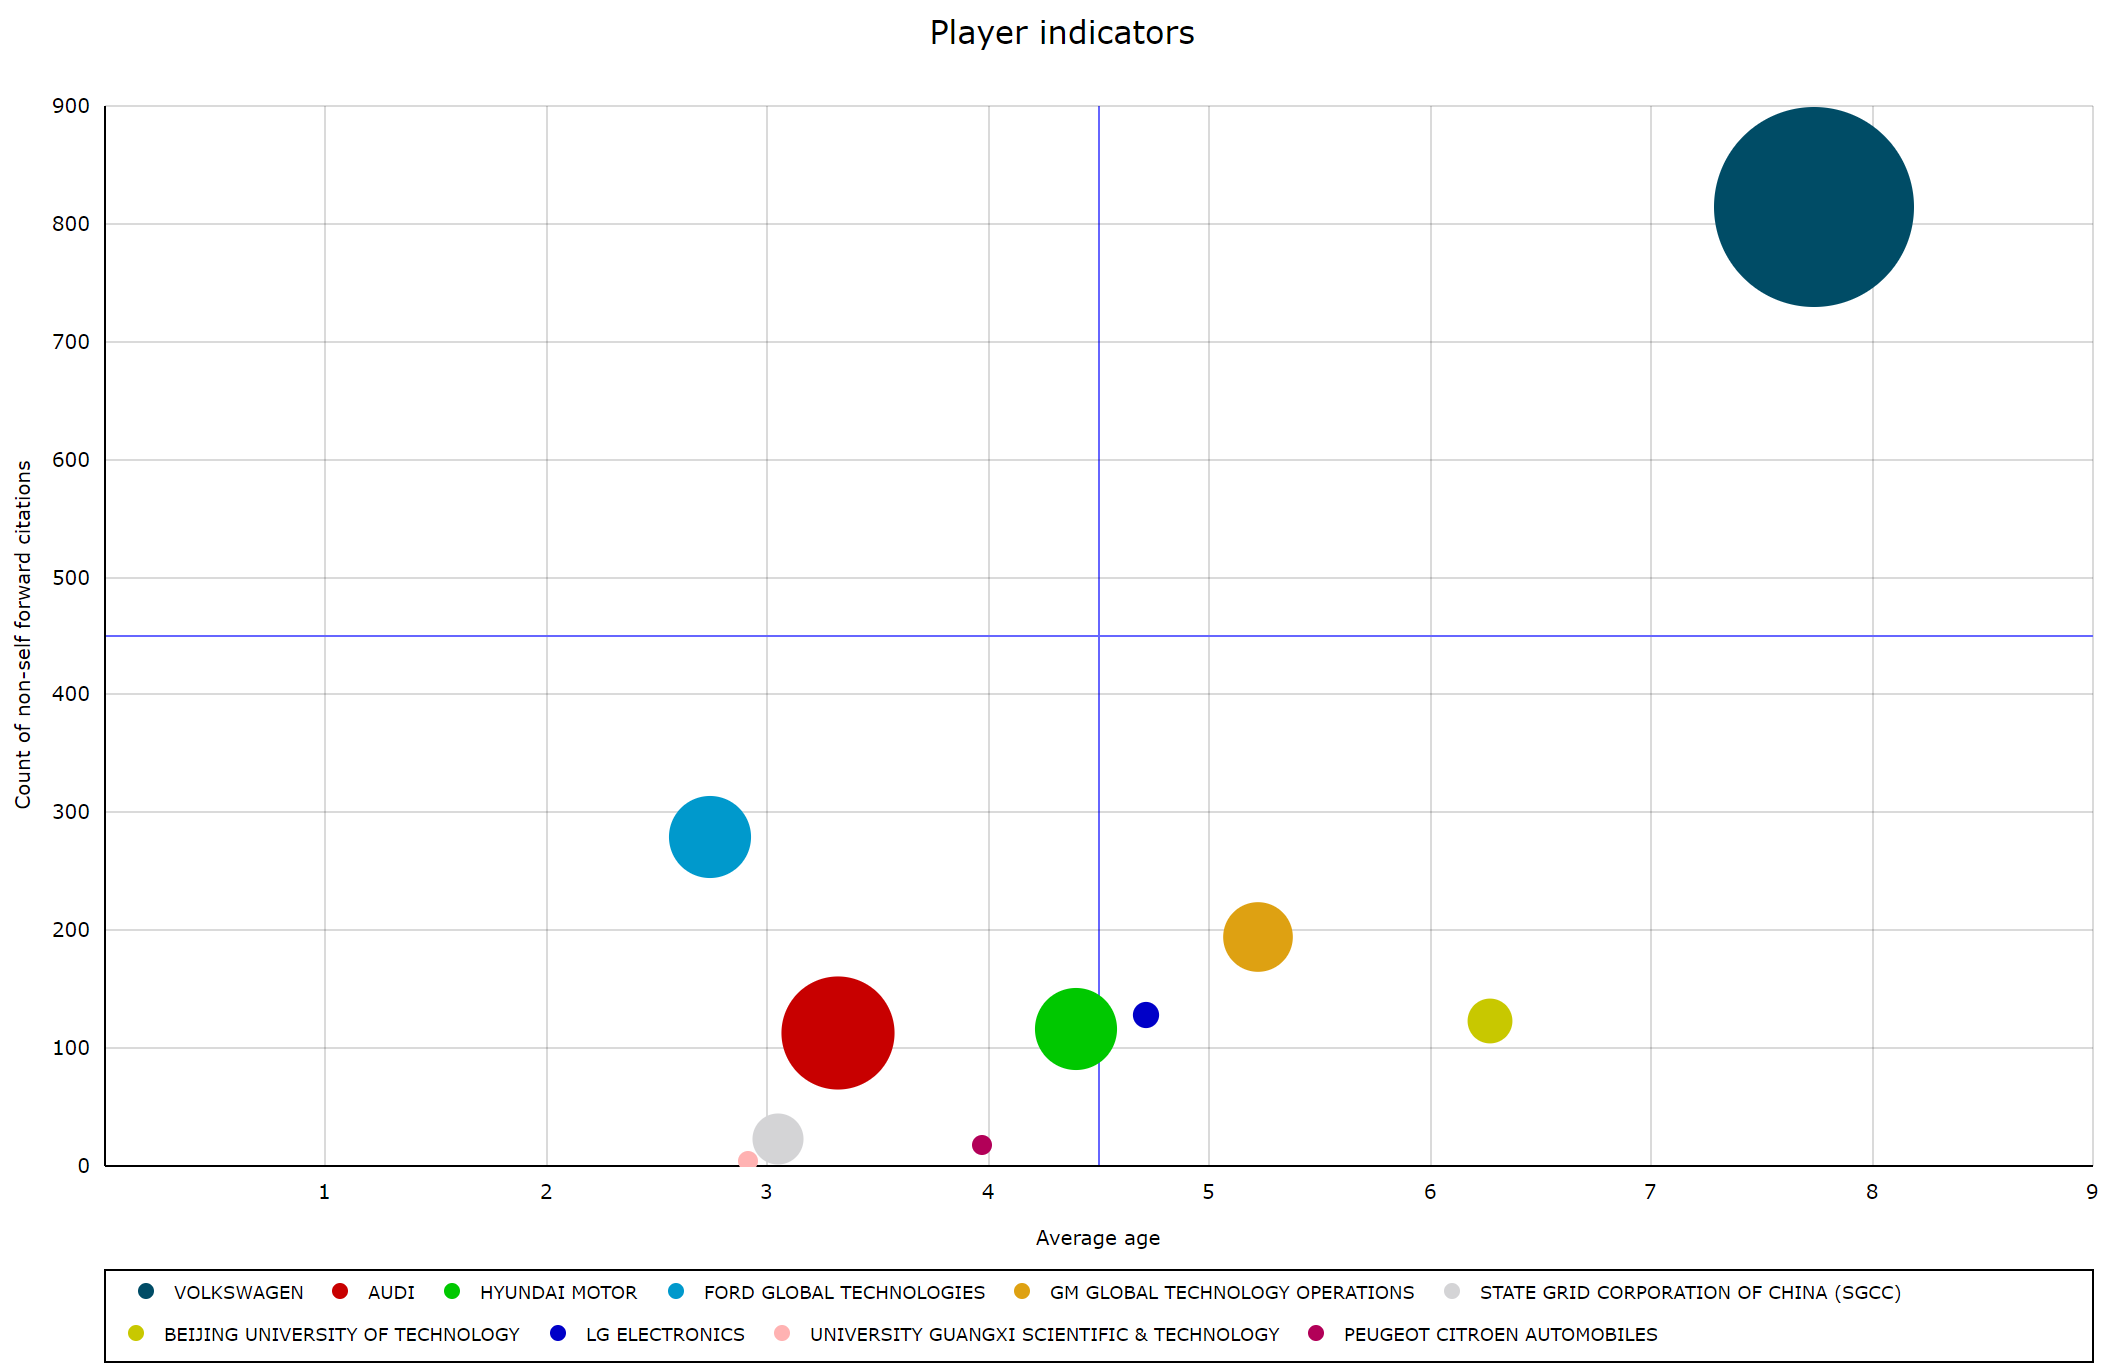
- Bubble plot chart
All of the other metrics are still available in the saved analysis. To access these additional metrics just click the save analysis button.