1-click Presentation
Extracting business intelligence insights.
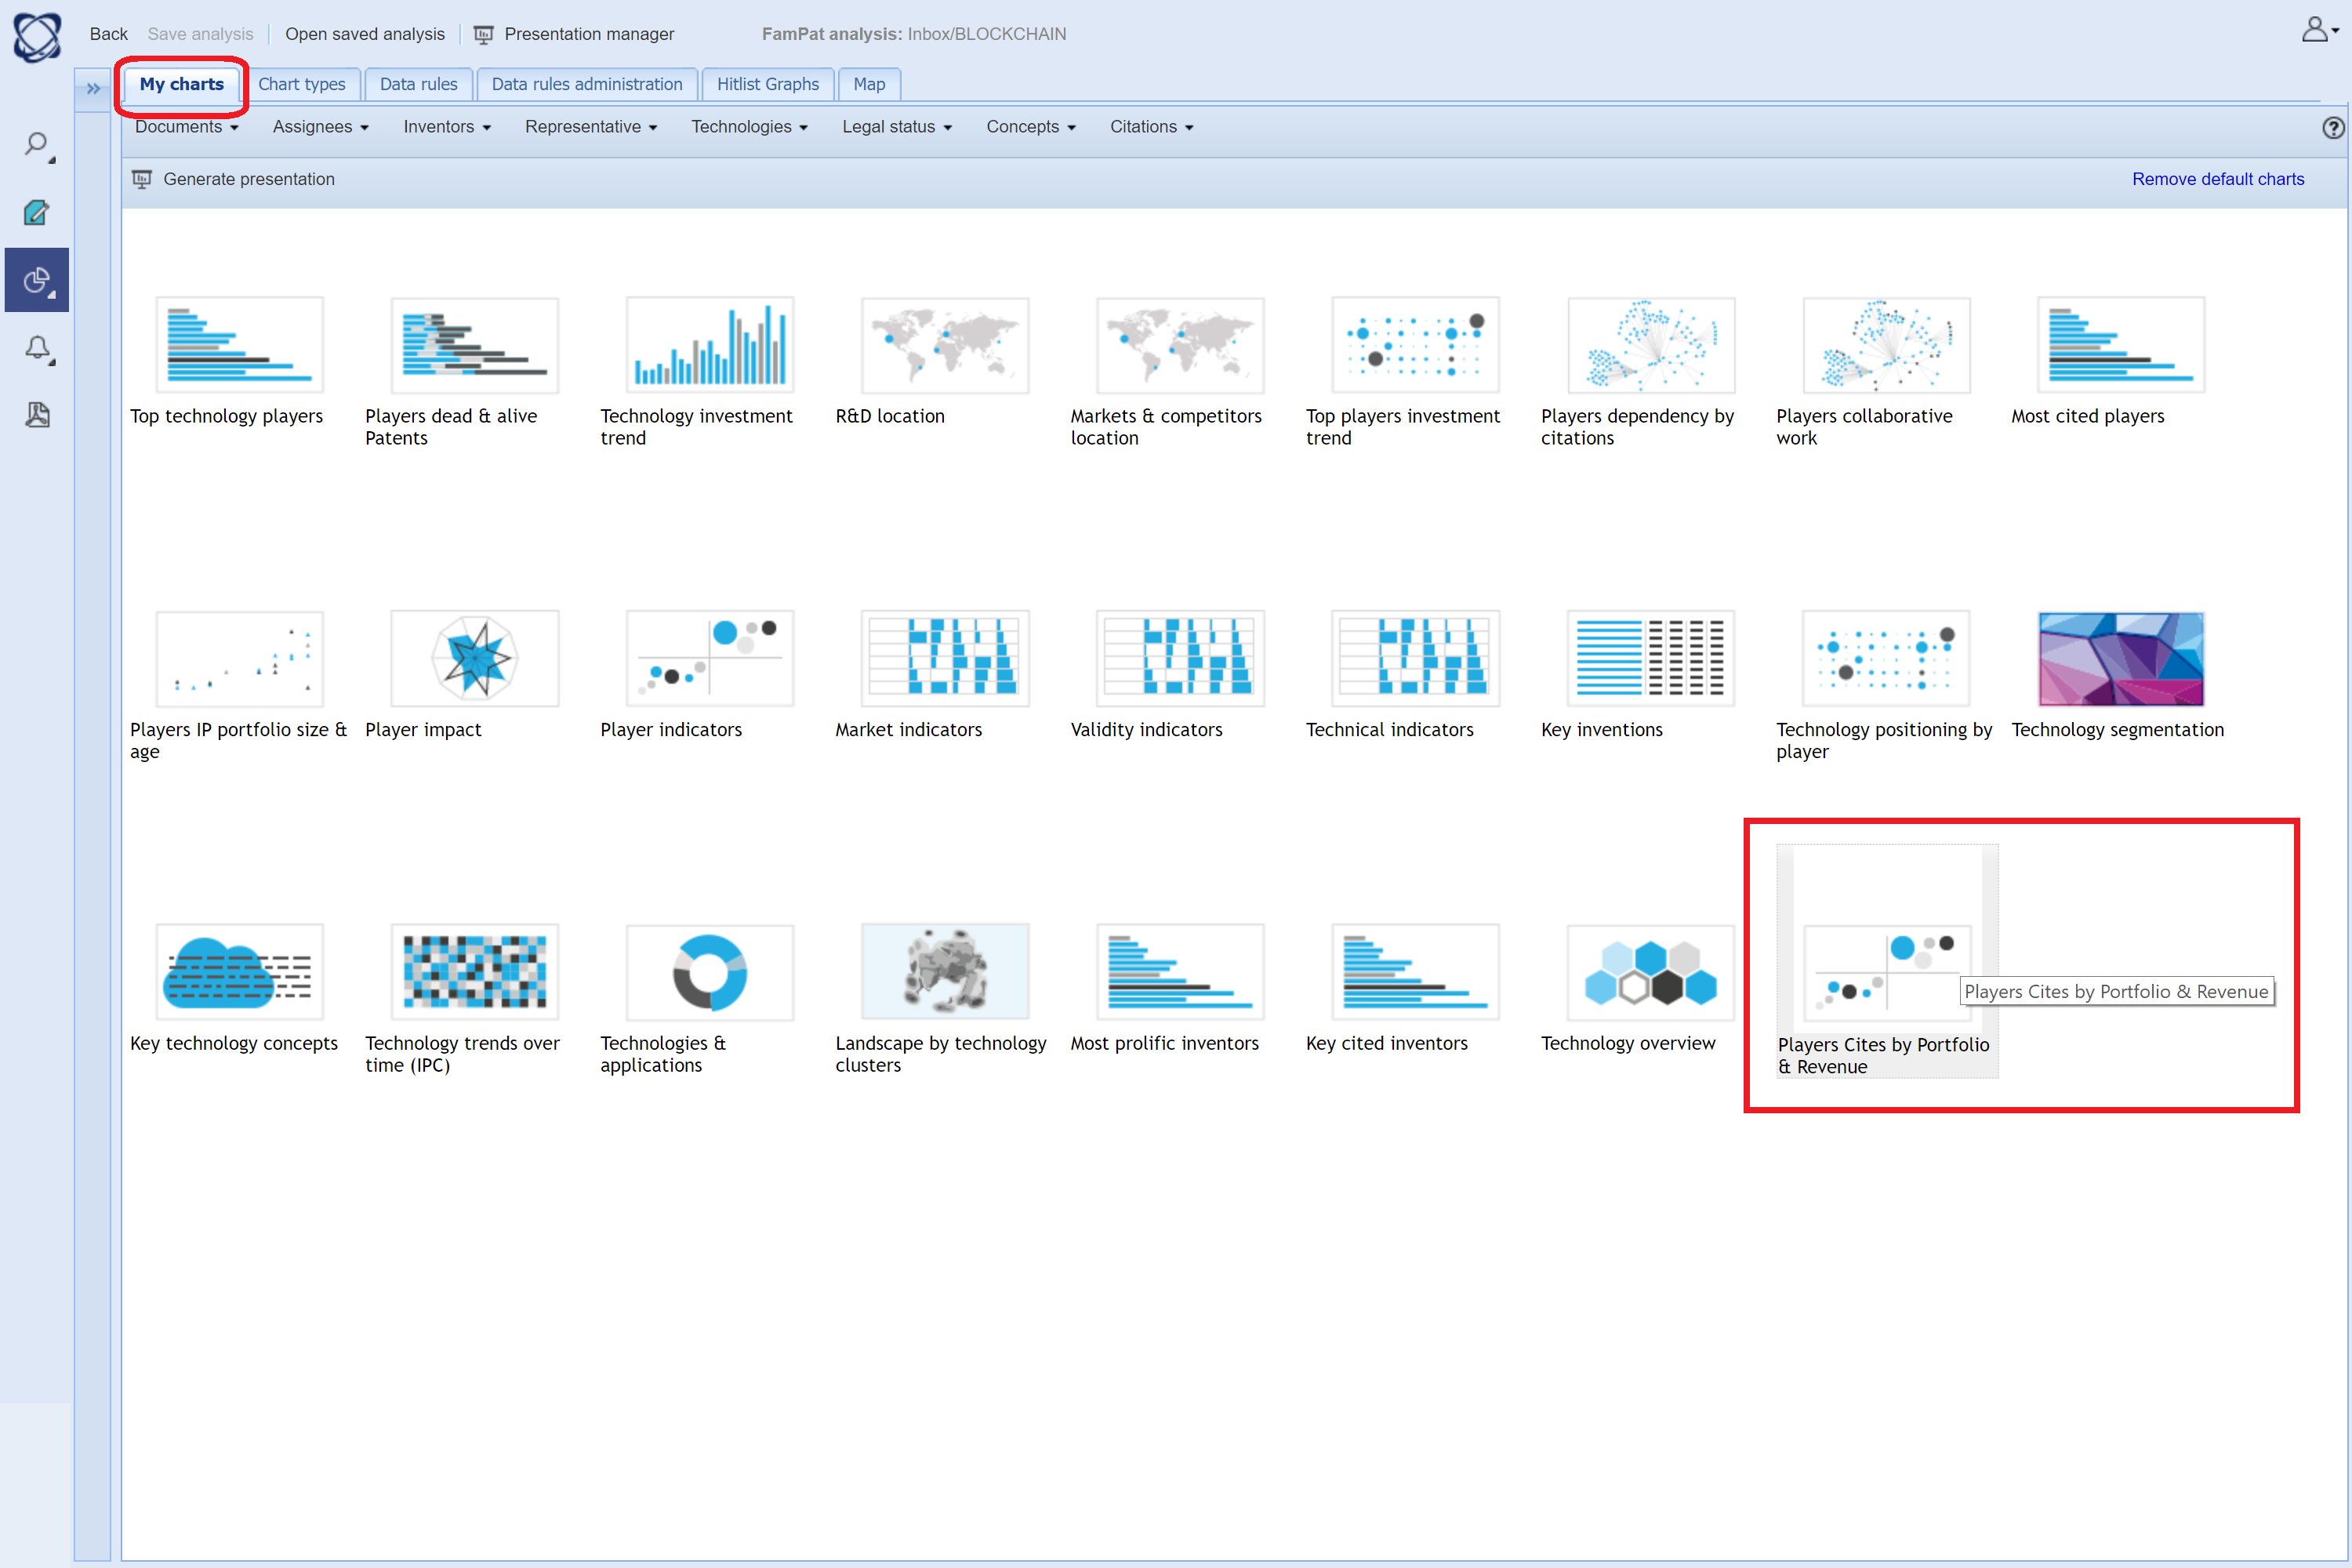
In just 1 click, generate and share a comprehensive IP Business Intelligence live link or PowerPoint presentation out of all charts listed in the "My charts" tab.
1. Pre-defined report
In live analysis mode, the following charts are included by default in the presentation:
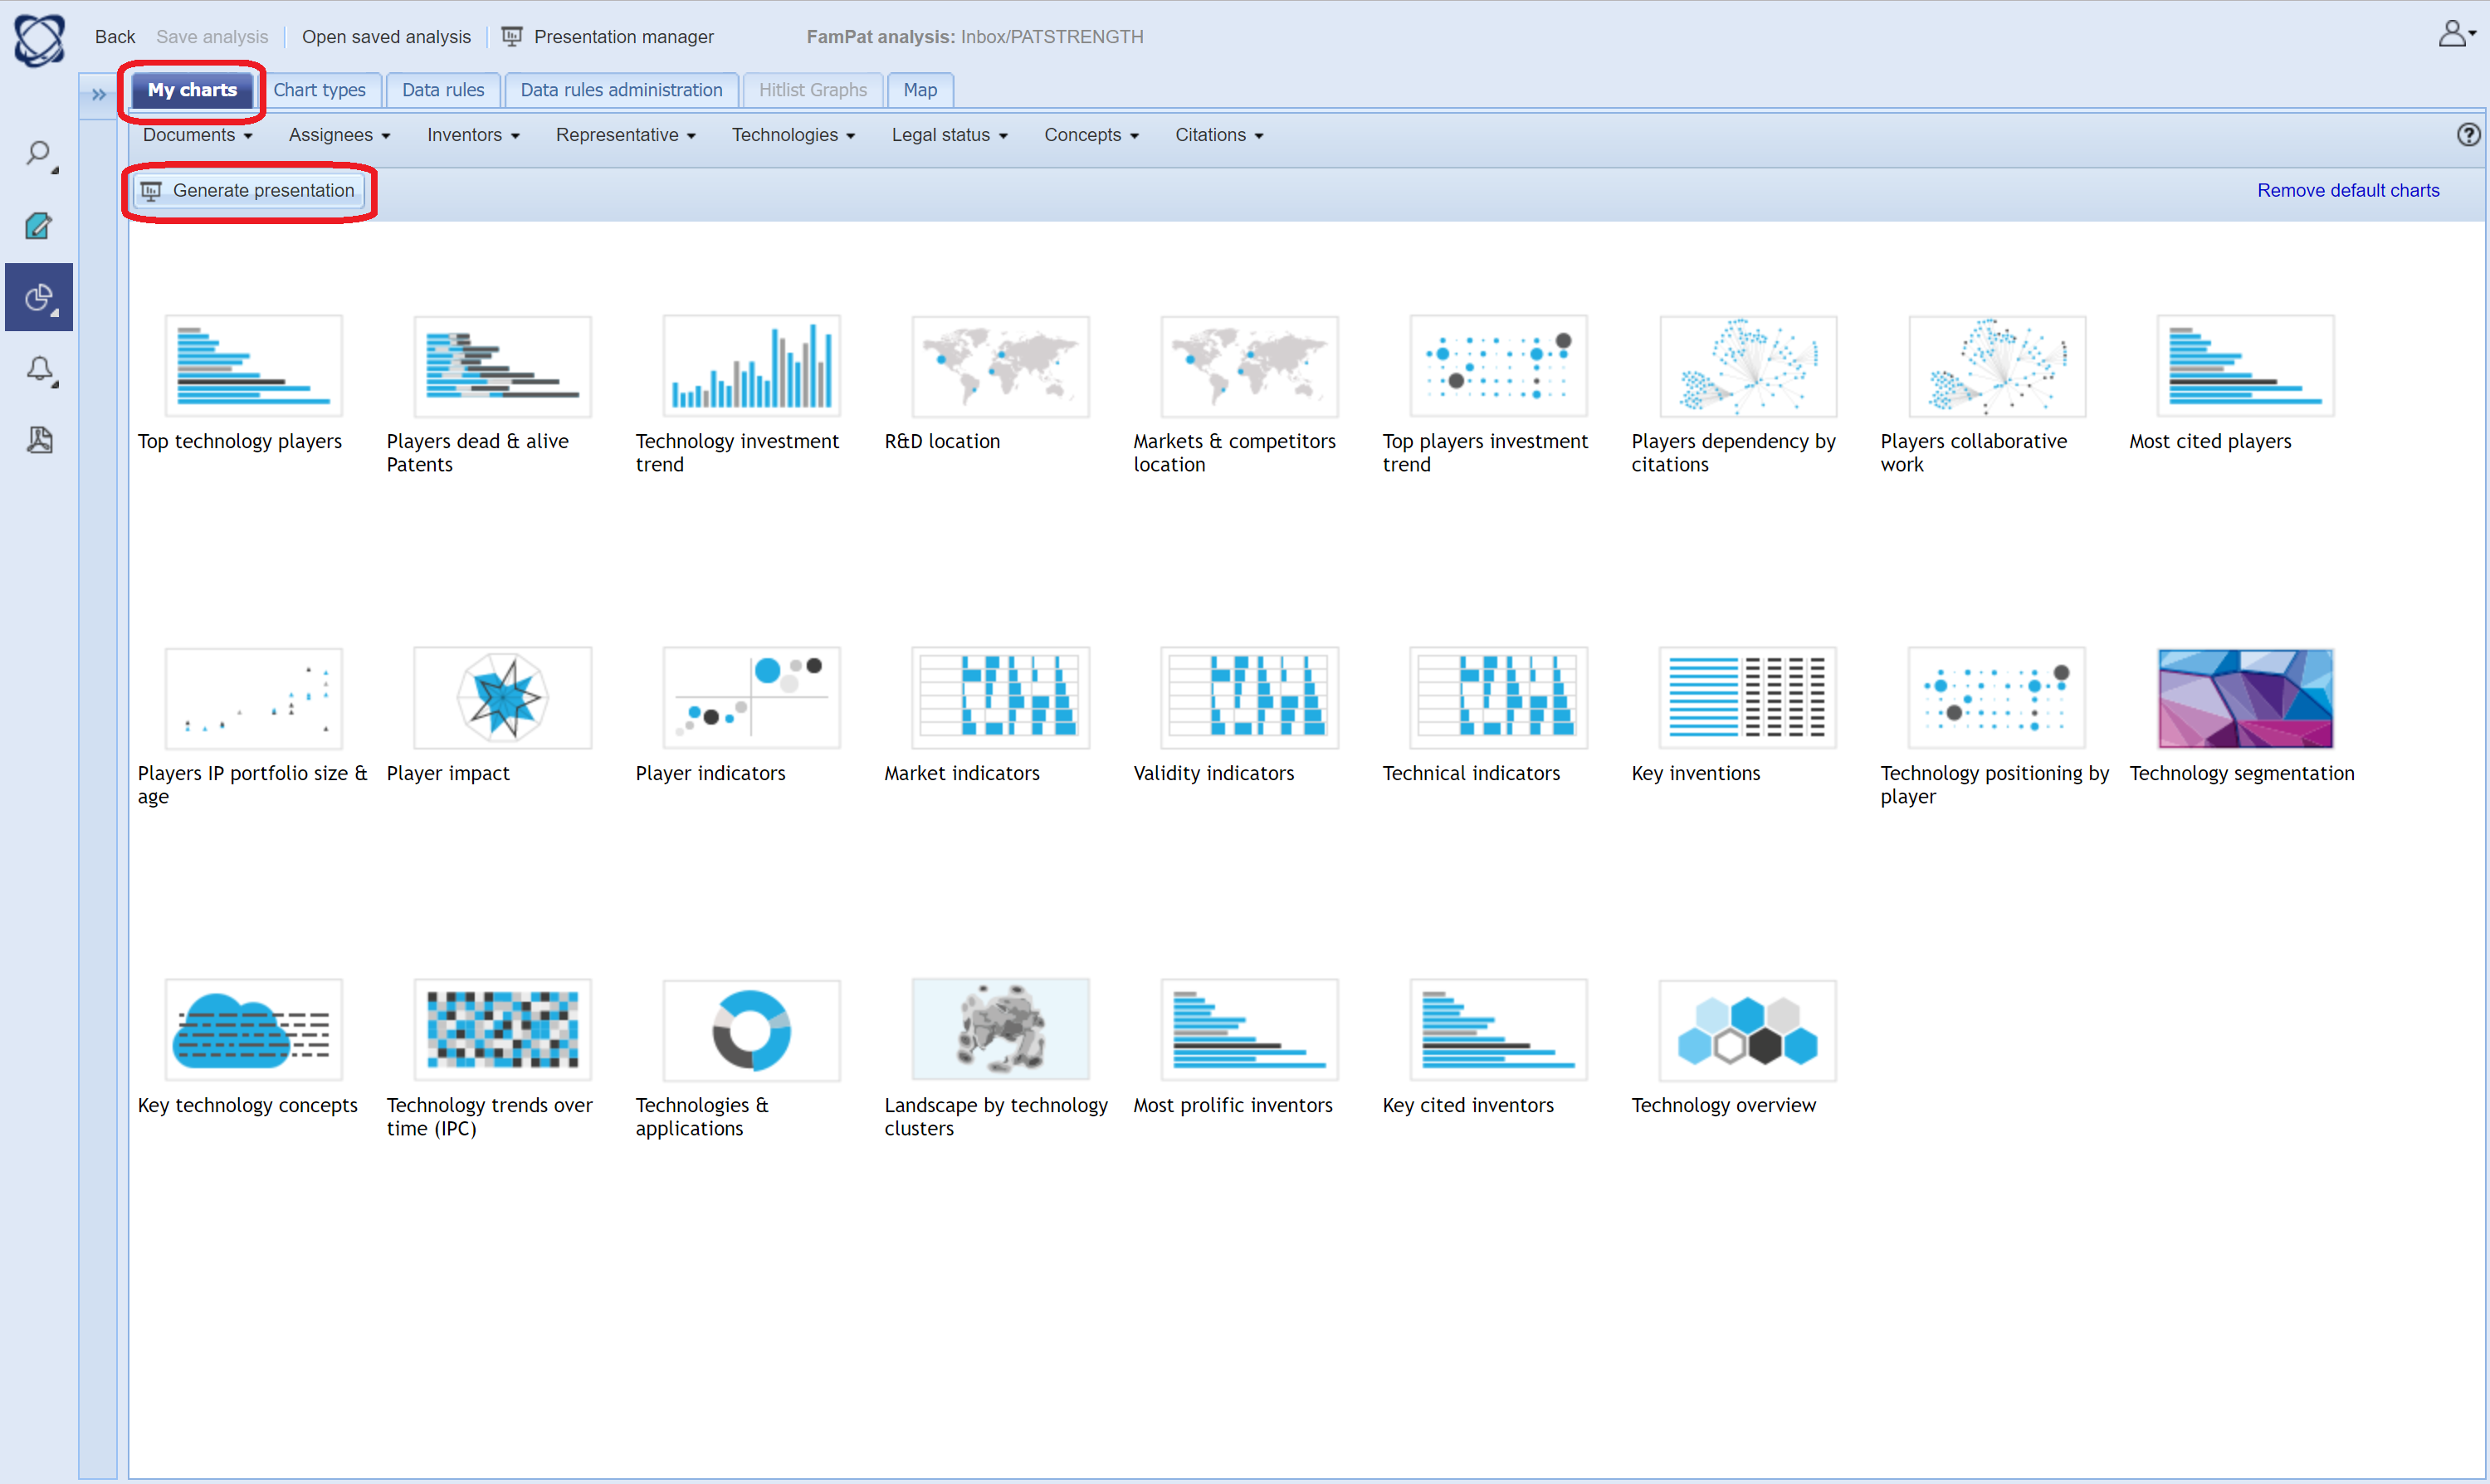
Clicking on the "Generate presentation" button will prompt you for a presentation title.
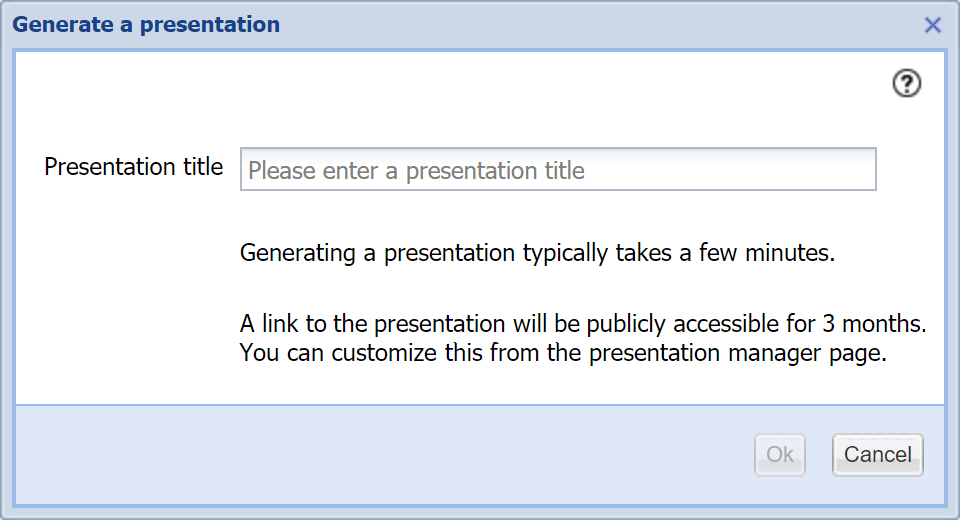
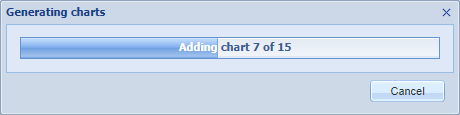
Once a title has been provided, the system processes the report, showing a progression bar.
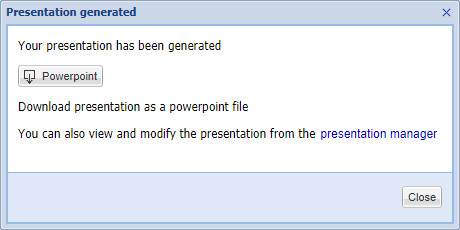
Once the processing is over, 2 options are offered to either download the presentation in Power Point format or to go the Presentation manager, in order to edit the presentation.
The Presentation manager page provides options to:
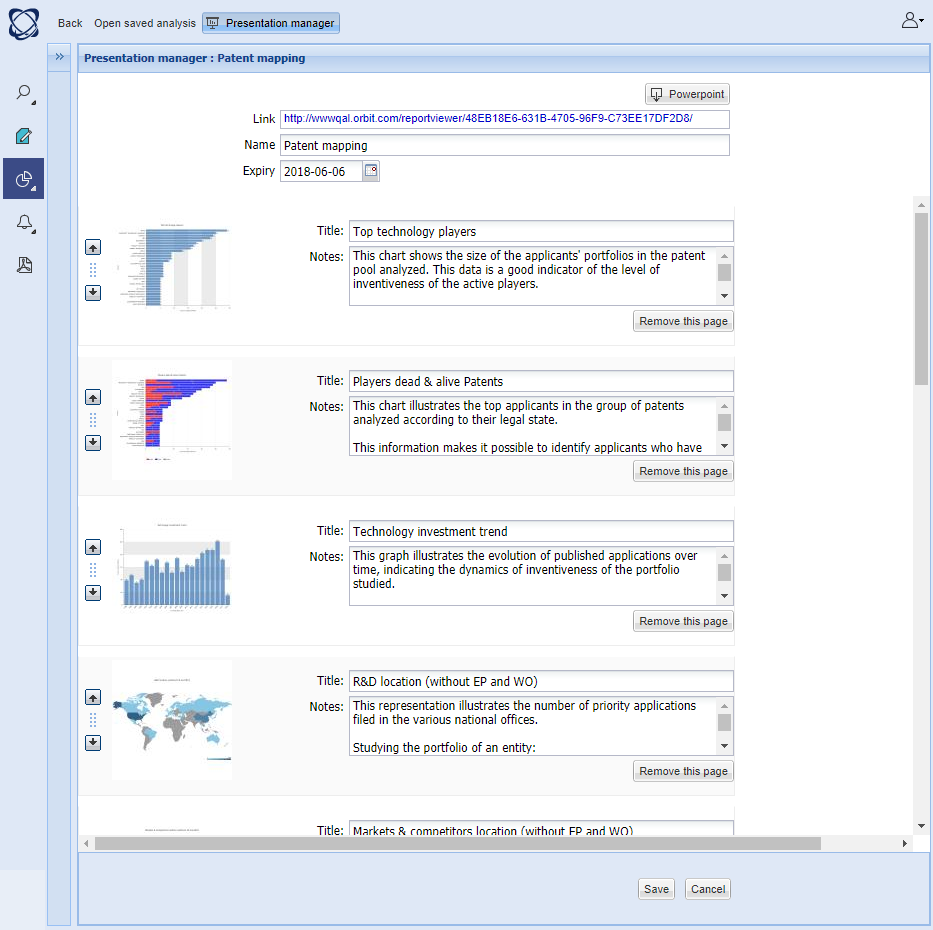
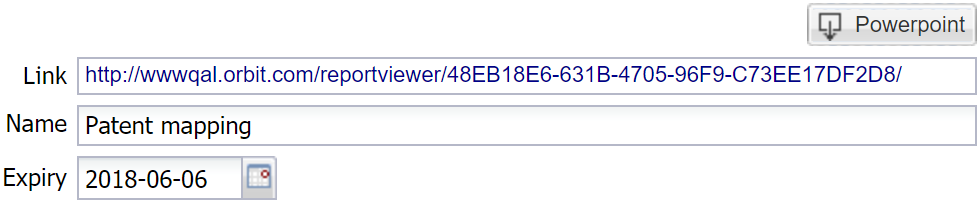
Once you are satisfied with the modifications, you can save the presentation, clicking on the " Save " button (at the bottom of the screen). To open the presentation, simply click on the link provided at the top of the page.
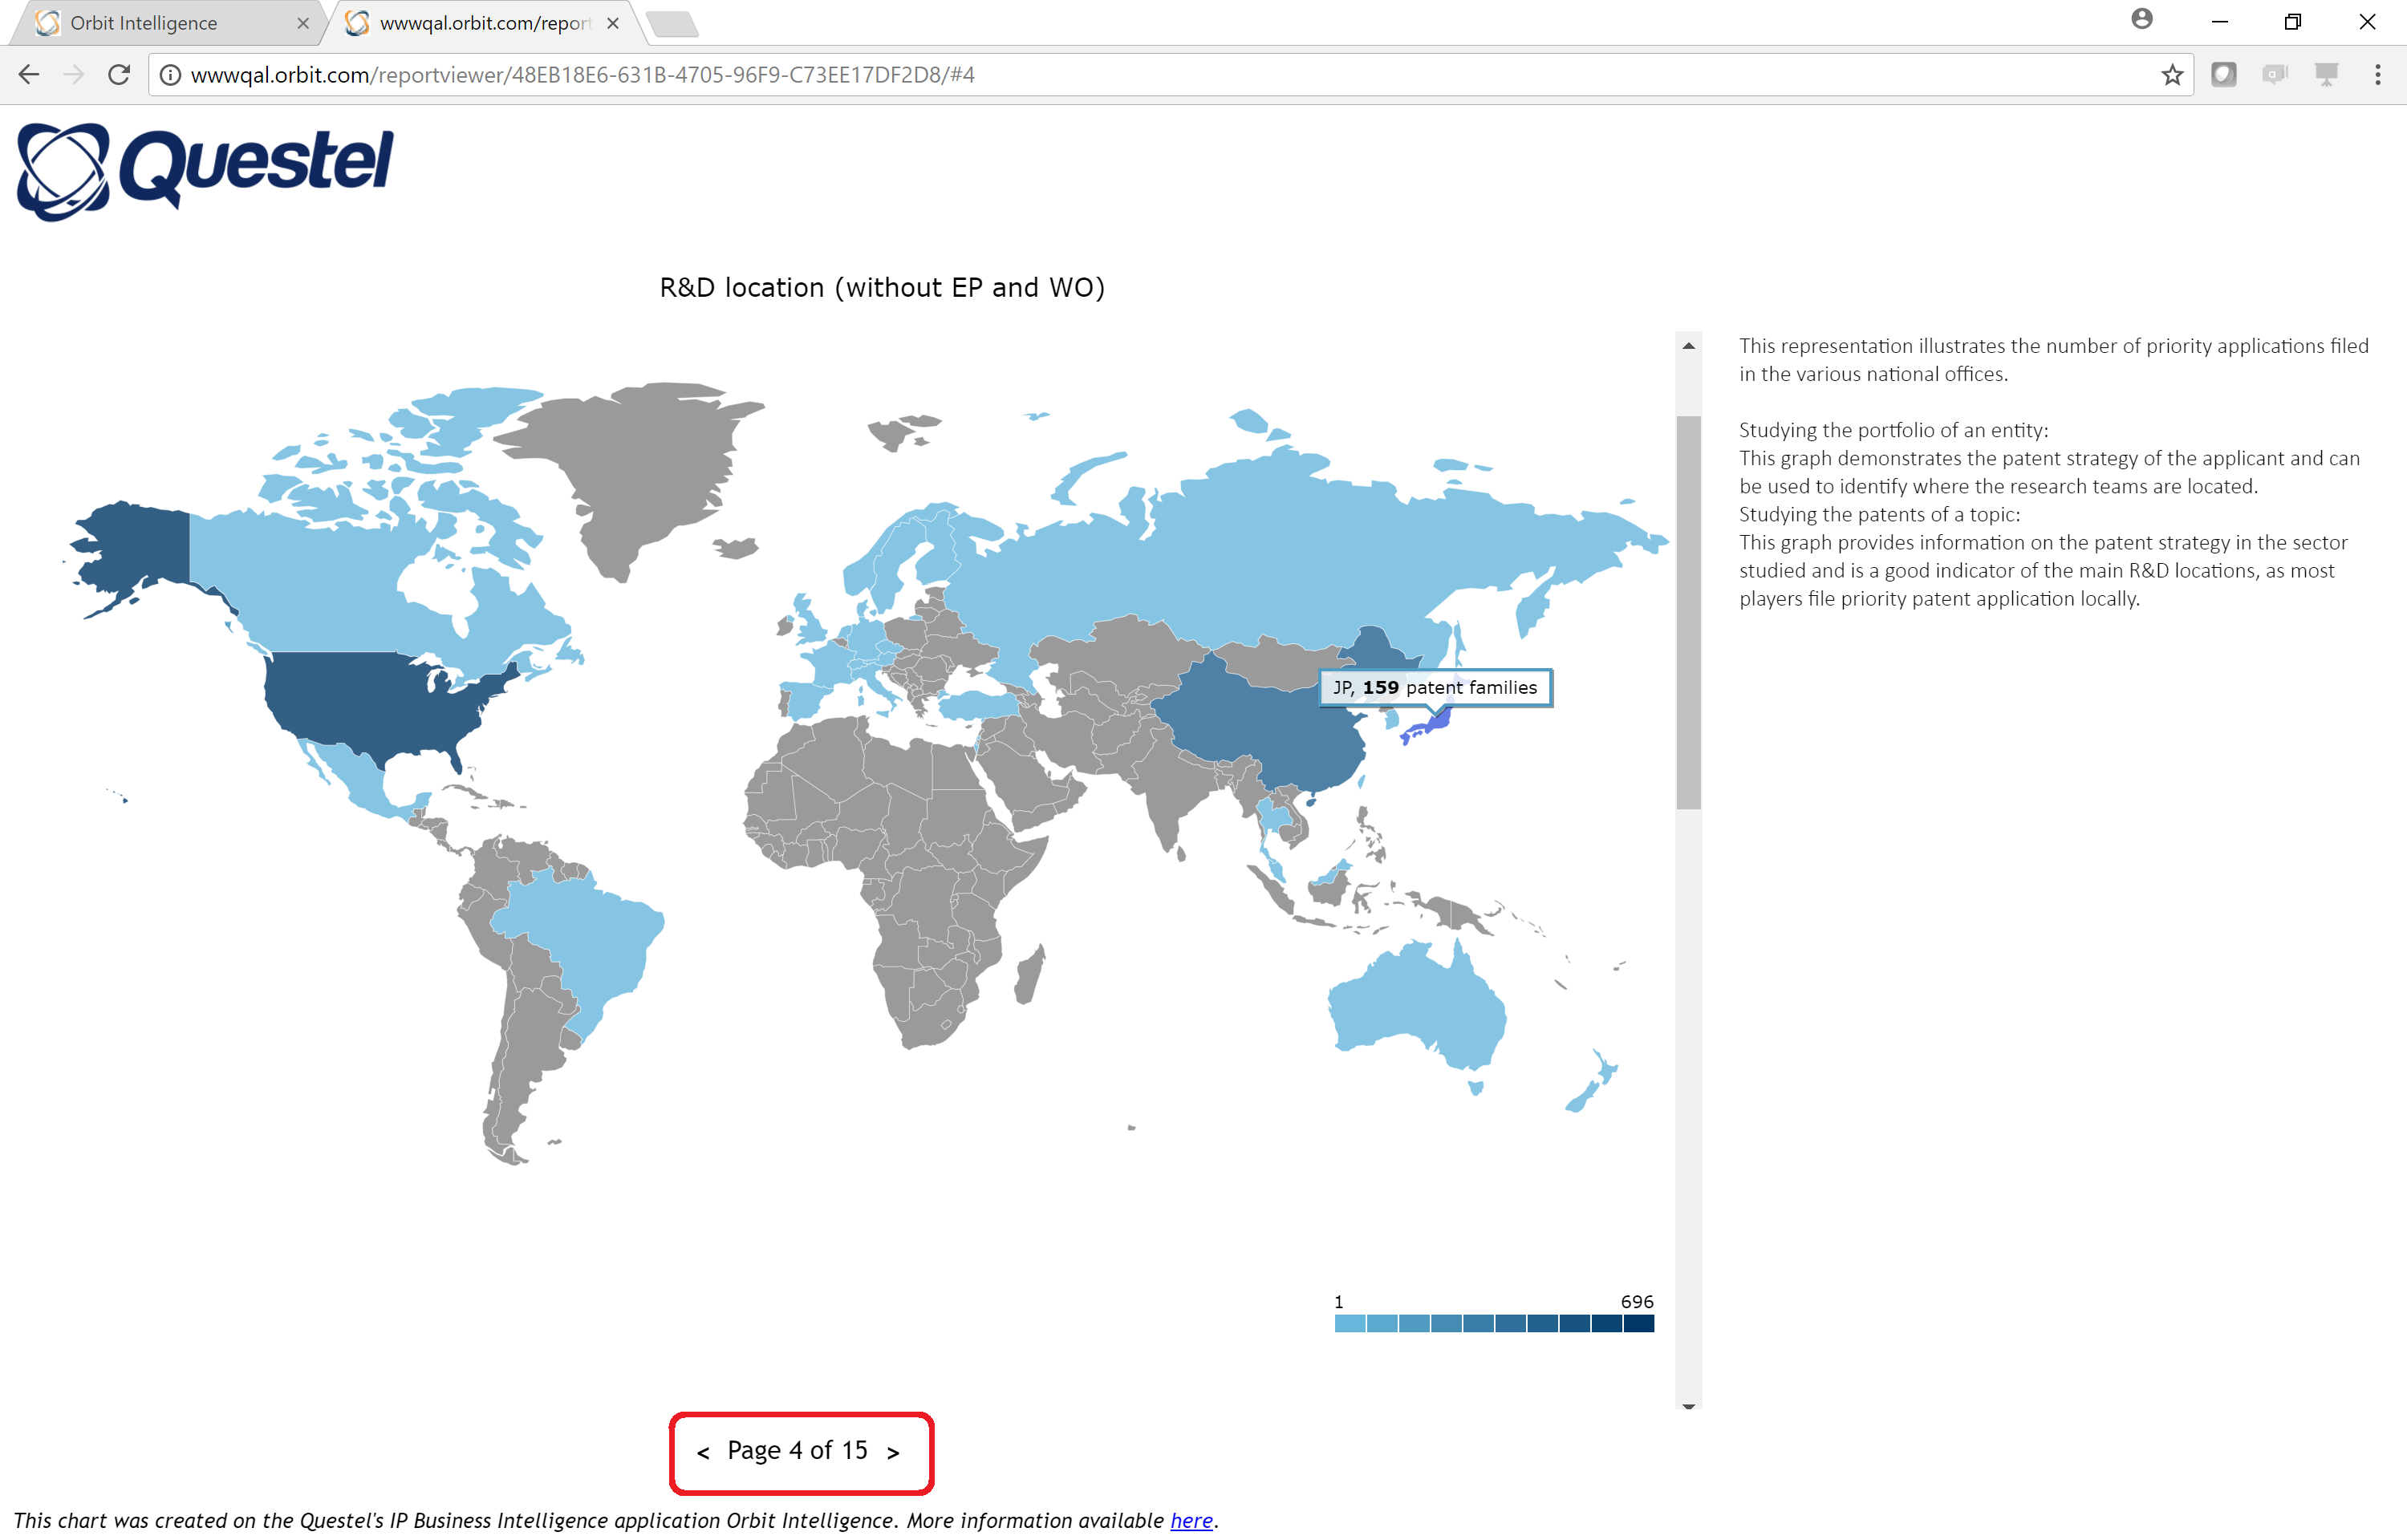
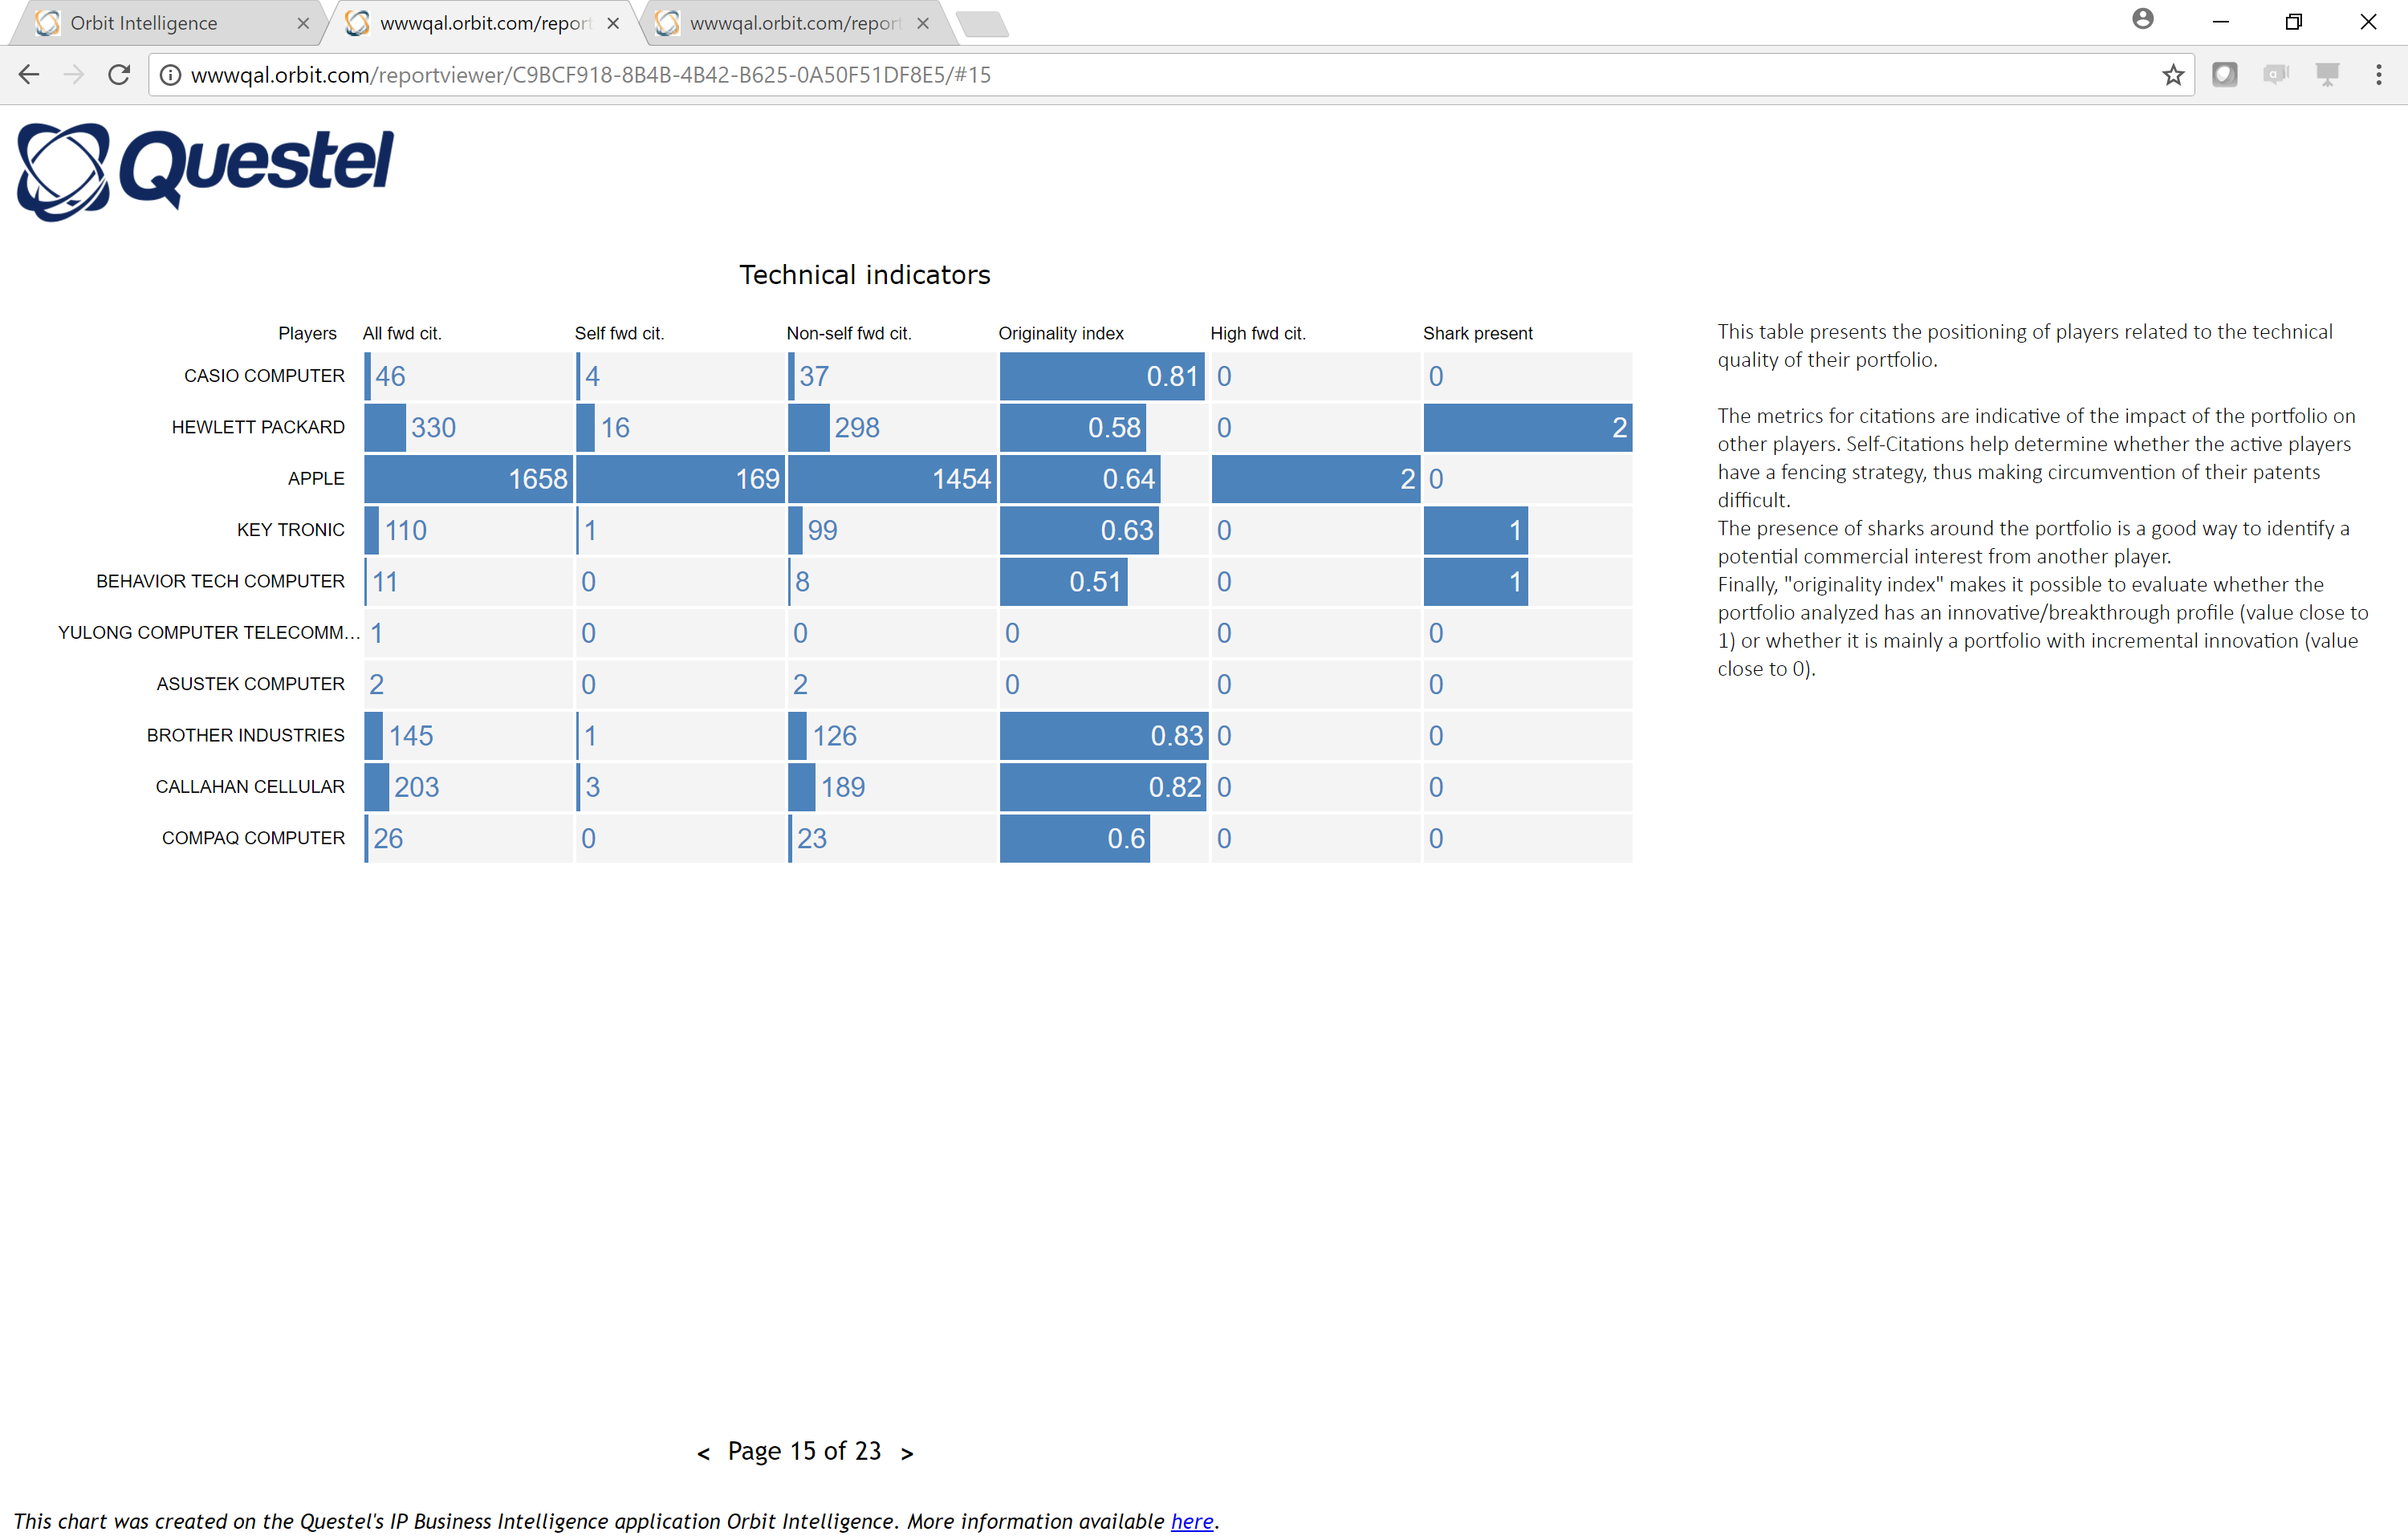
The presentation is then accessible in the browser and slides can be browsed using the navigation arrows. The link can be shared with any third party, including non Orbit Intelligence subscribers.
Default 1-click presentation generated from a live Gold analysis
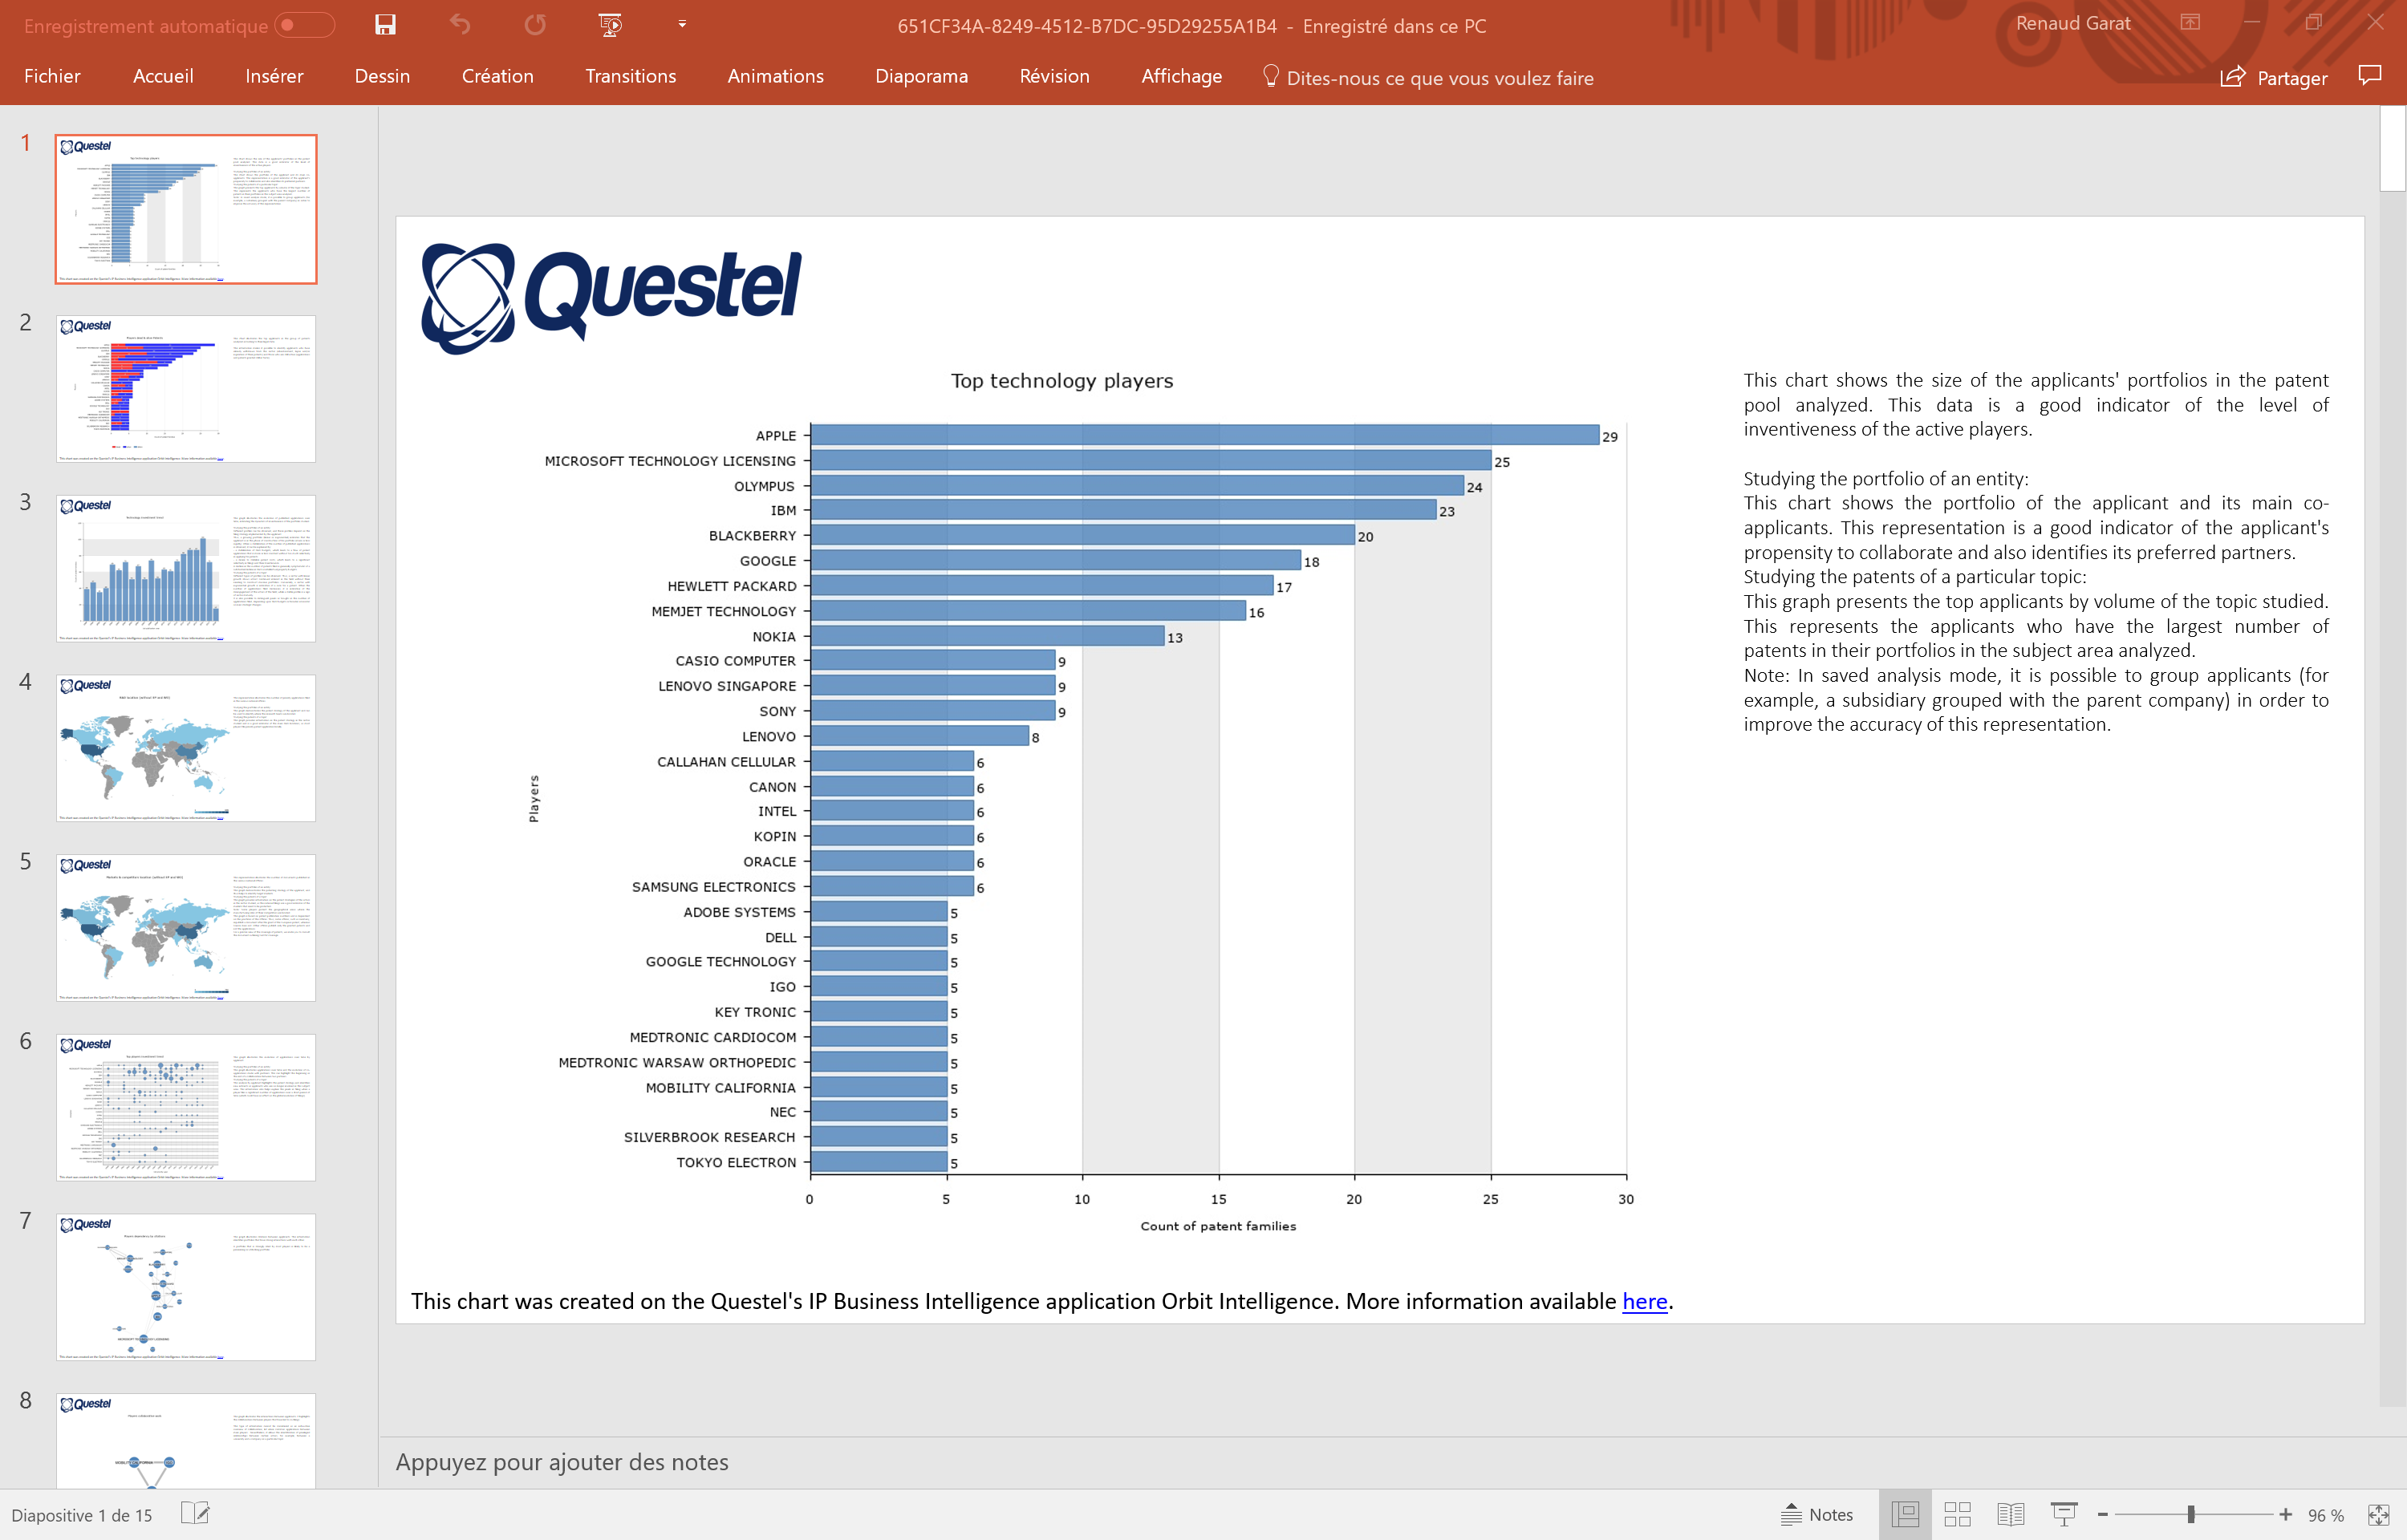
Default 1-click presentation generated from a saved Platinum analysis
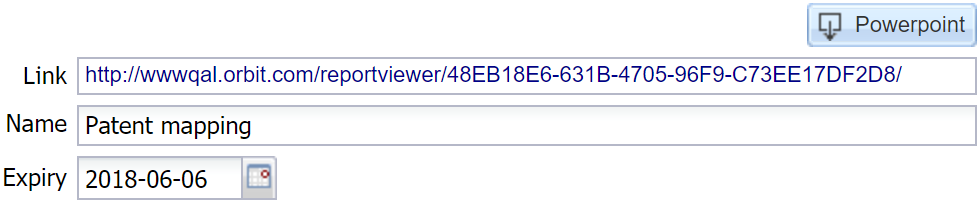
To download the presentation to Powerpoint, simply click on the Powerpoint button at the top of the page.
2. Customized report
All charts can be fully customized and added to the " My charts " section. As a consequence, they will be part of the 1-click presentation. Specific charts can also be excluded from your presentation, in the Presentation Manager.
All chart titles and descriptions can also be modified from the Presentation Manager.
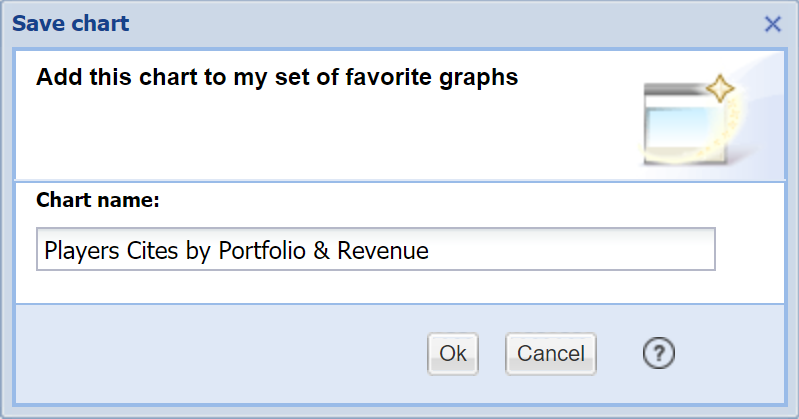
Add any customized chart to the " My charts " tab, clicking on the " heart " button, at the top right of the screen.
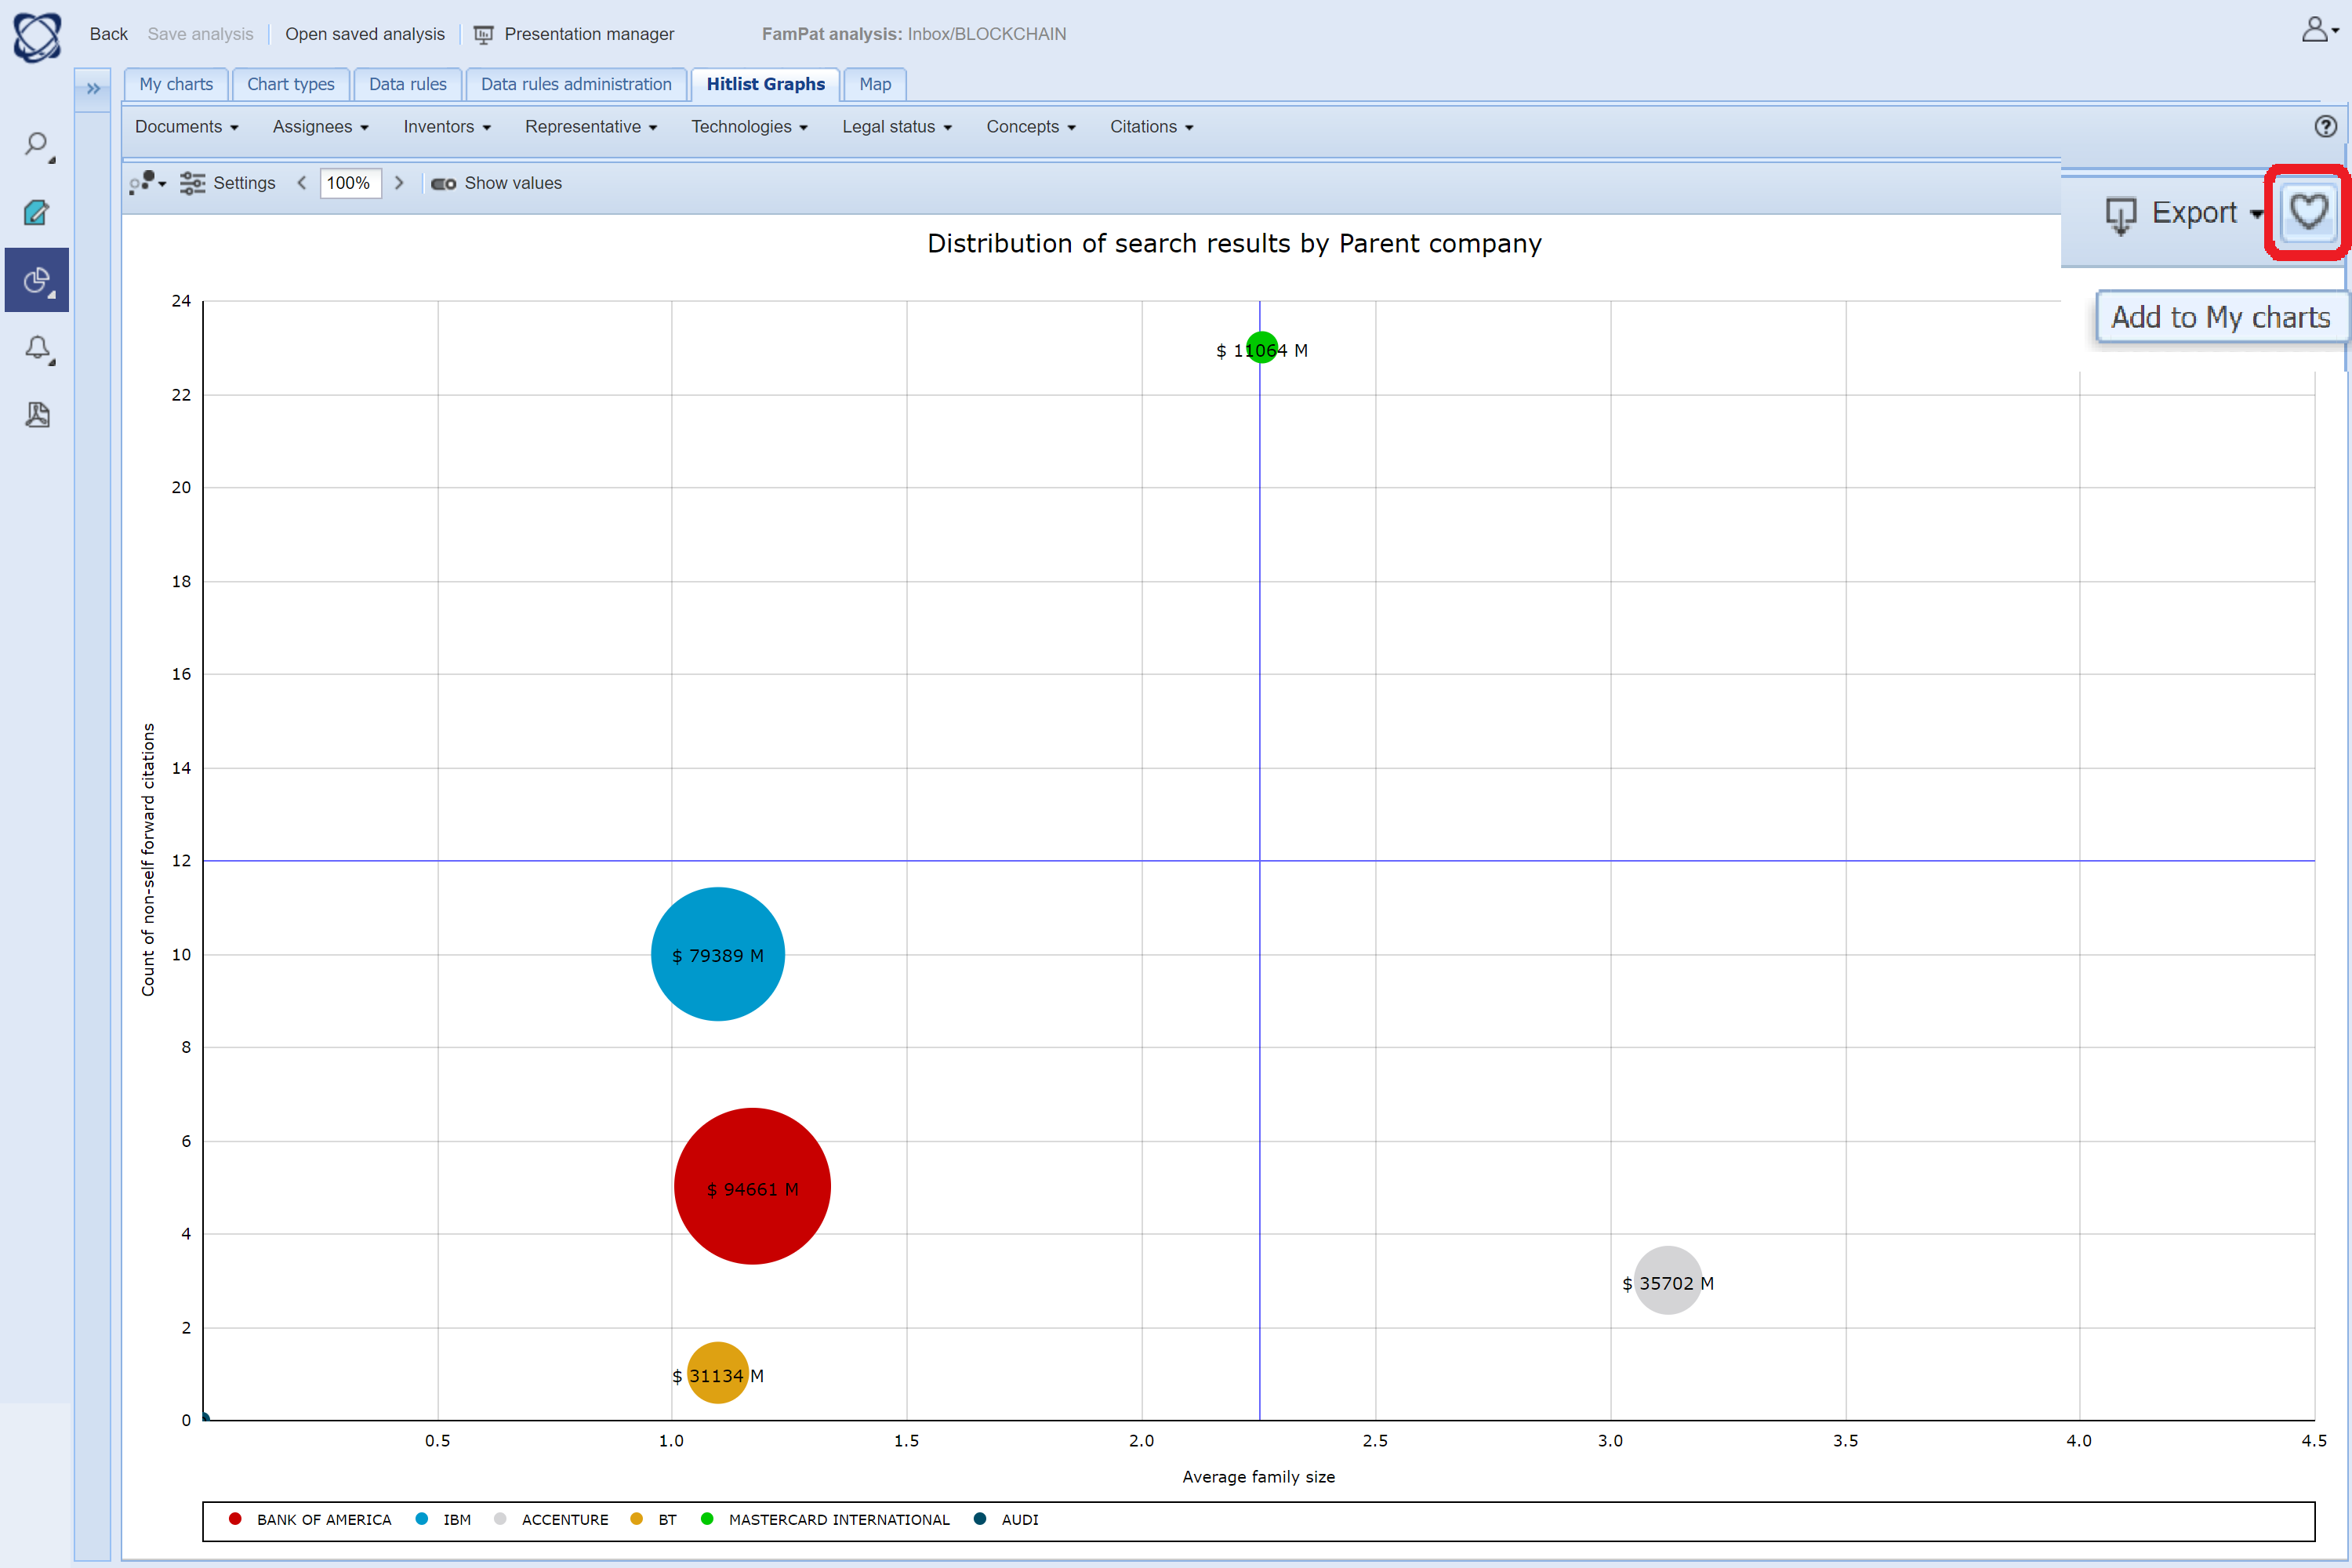
You are then prompted for a chart title.
As a consequence, this chart (and all other customized charts) will be added to the 1-click presentation whenever this report is requested.