Protected countries
Overcoming a common and yet essential patent coverage pitfall
It can be complicated to really know in which countries an invention is protected. Going through the list of publications is far from enough, since some countries do not publish any documents. For instance, several major countries such as France, the UK, Italy, Sweden, Belgium, Luxembourg or the Netherlands do not republish patents going through the European (EP) route. Germany seems to be increasingly embracing this approach.
Therefore, it is necessary to go through the legal status information of each European country to check whether the invention is actually protected there. The process is laborious, time-consuming and inefficient.
See at a glance where an invention is protected
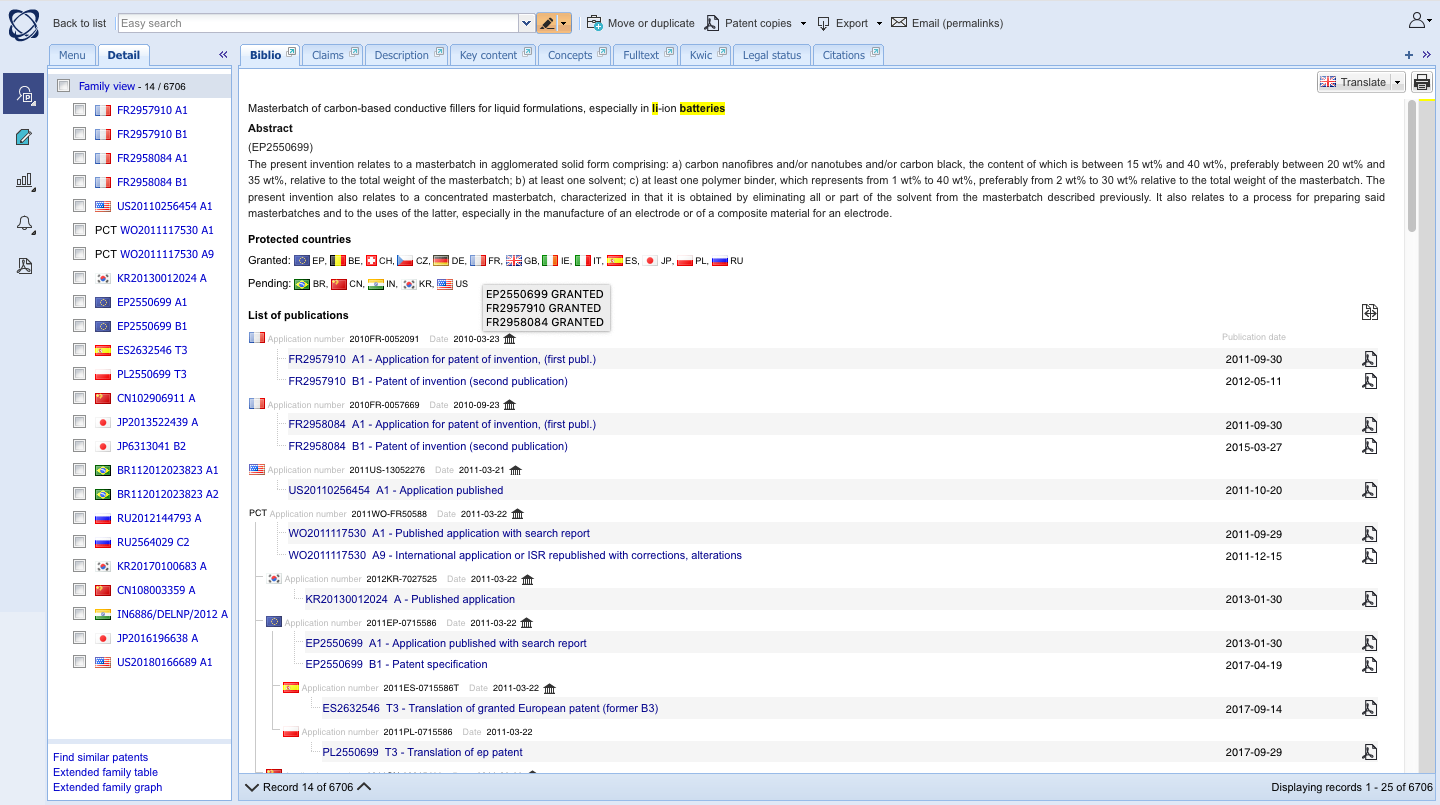
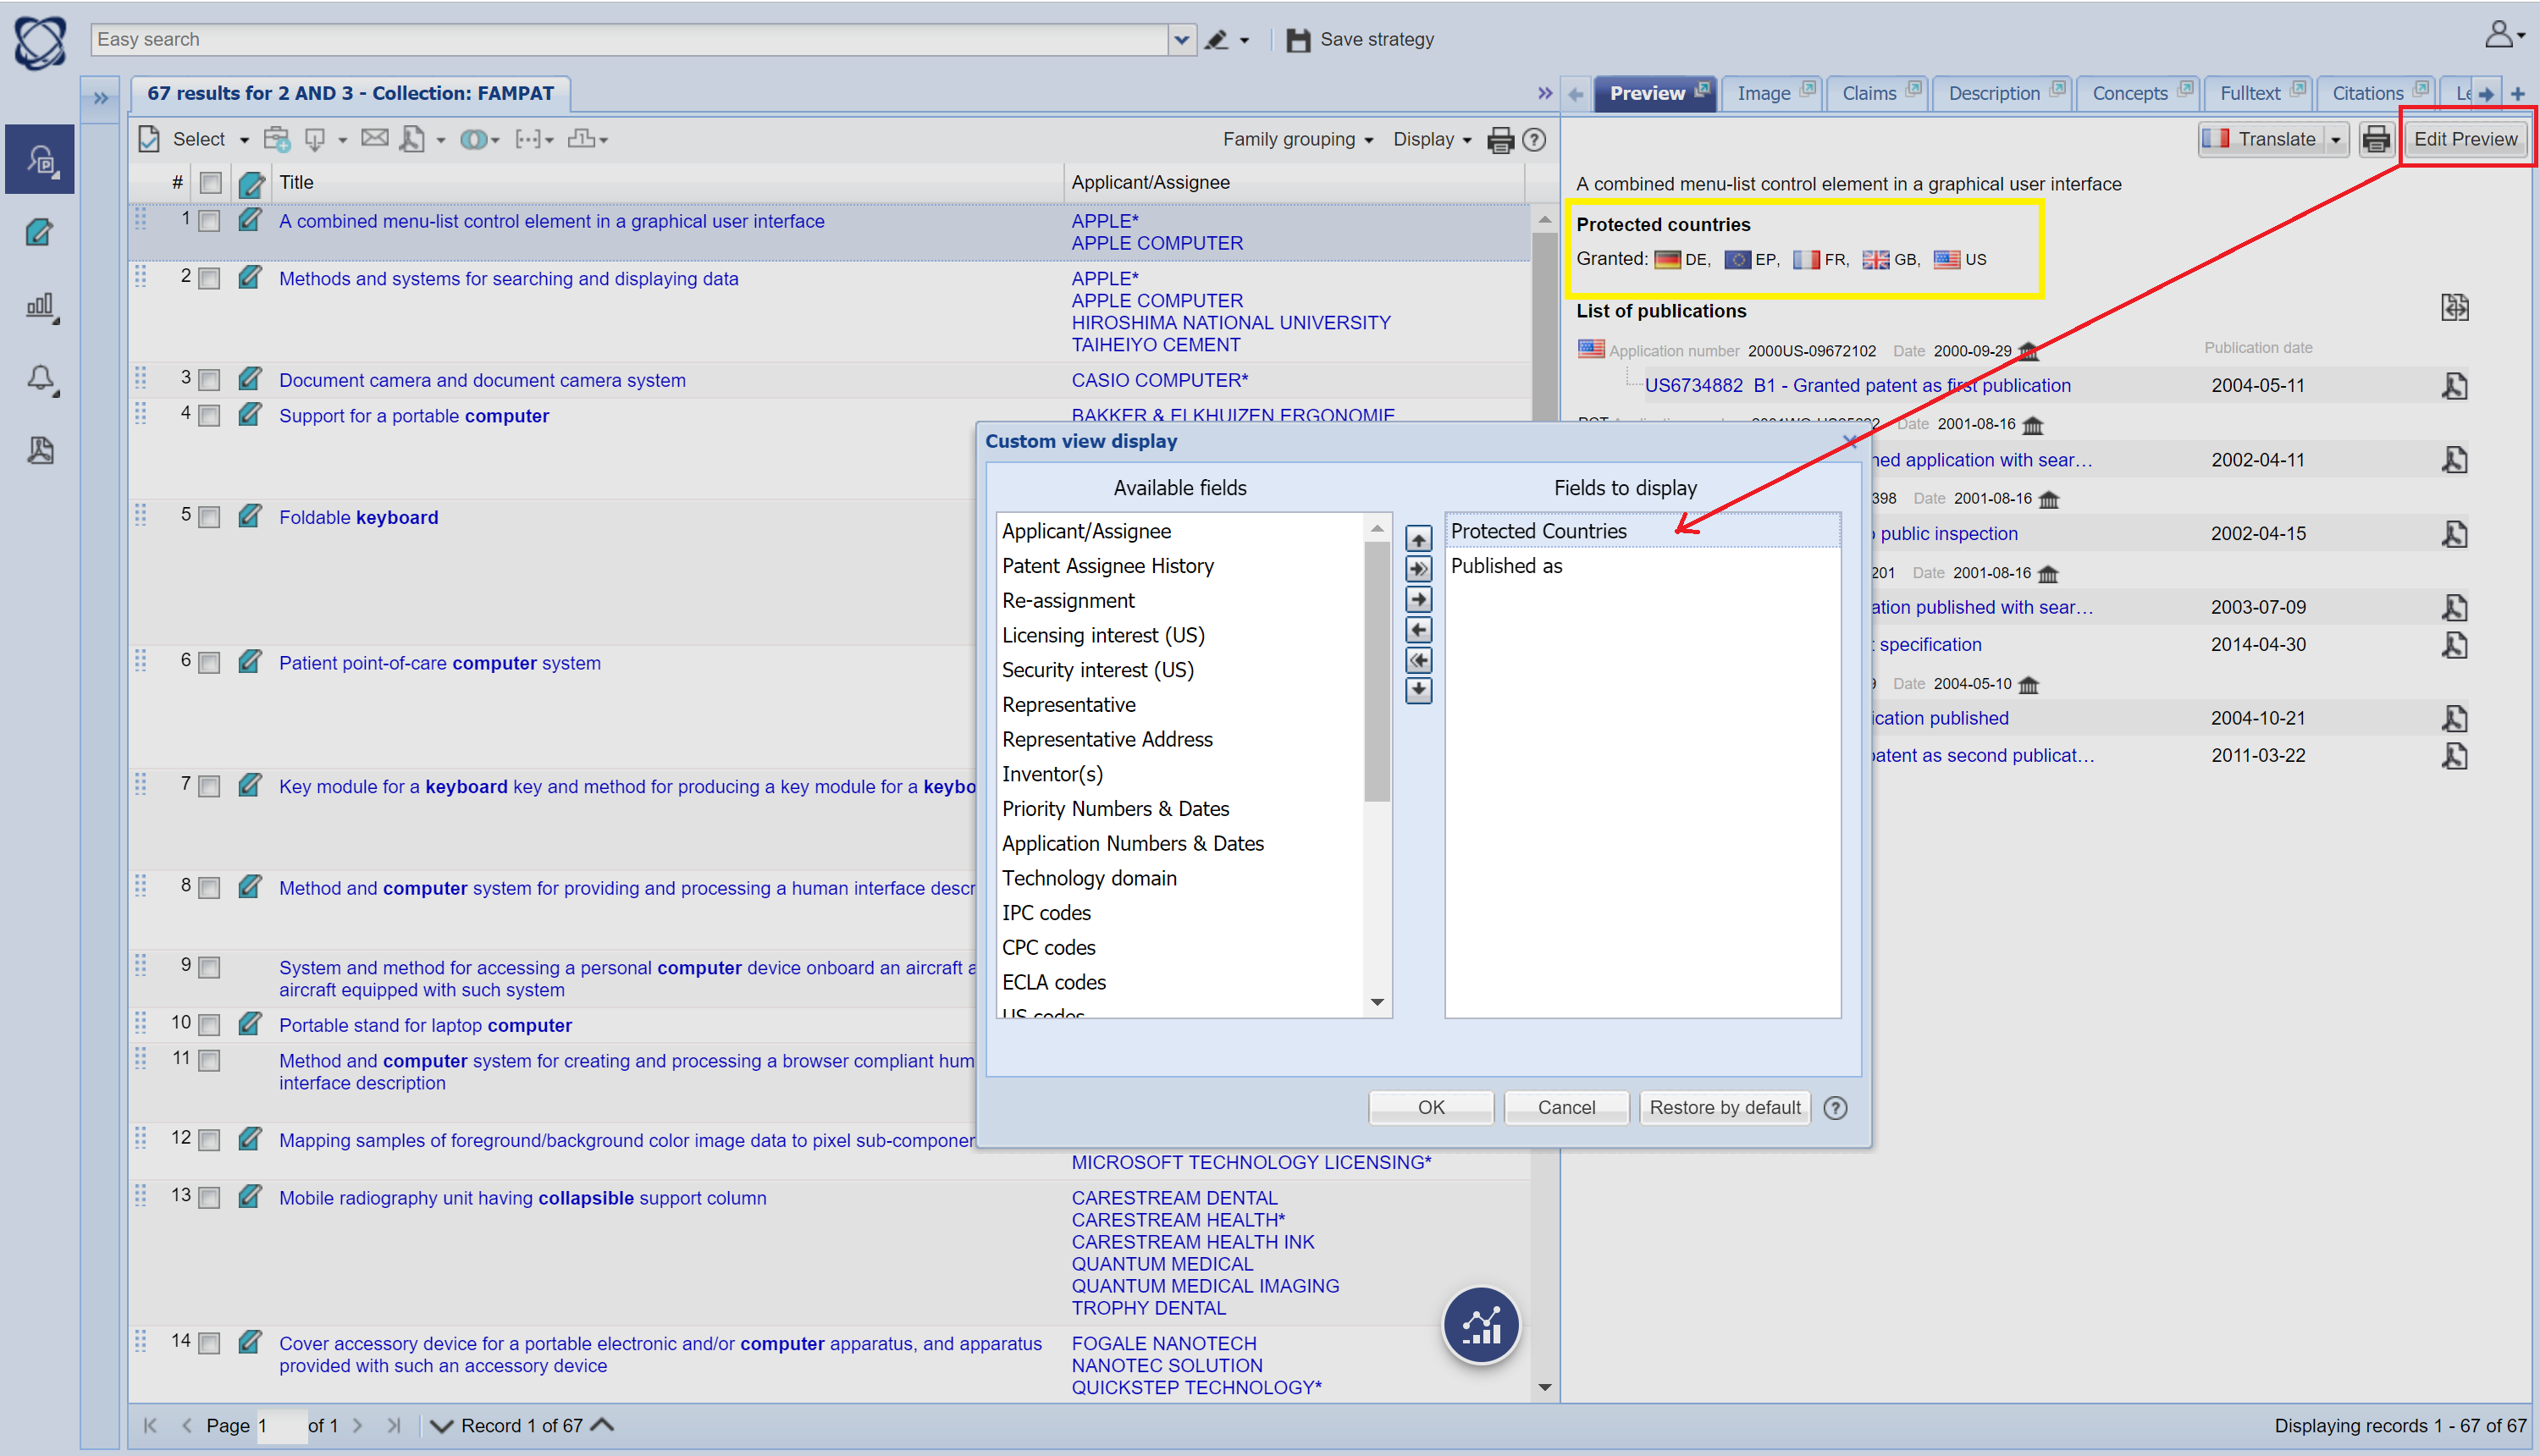
Questel has therefore created a new high value-added field that allows you to see at a glance, for a patent family which is alive, the list of countries where the patent rights are either pending or granted. This field, called "Protected countries", is available in the preview and biblio tabs.
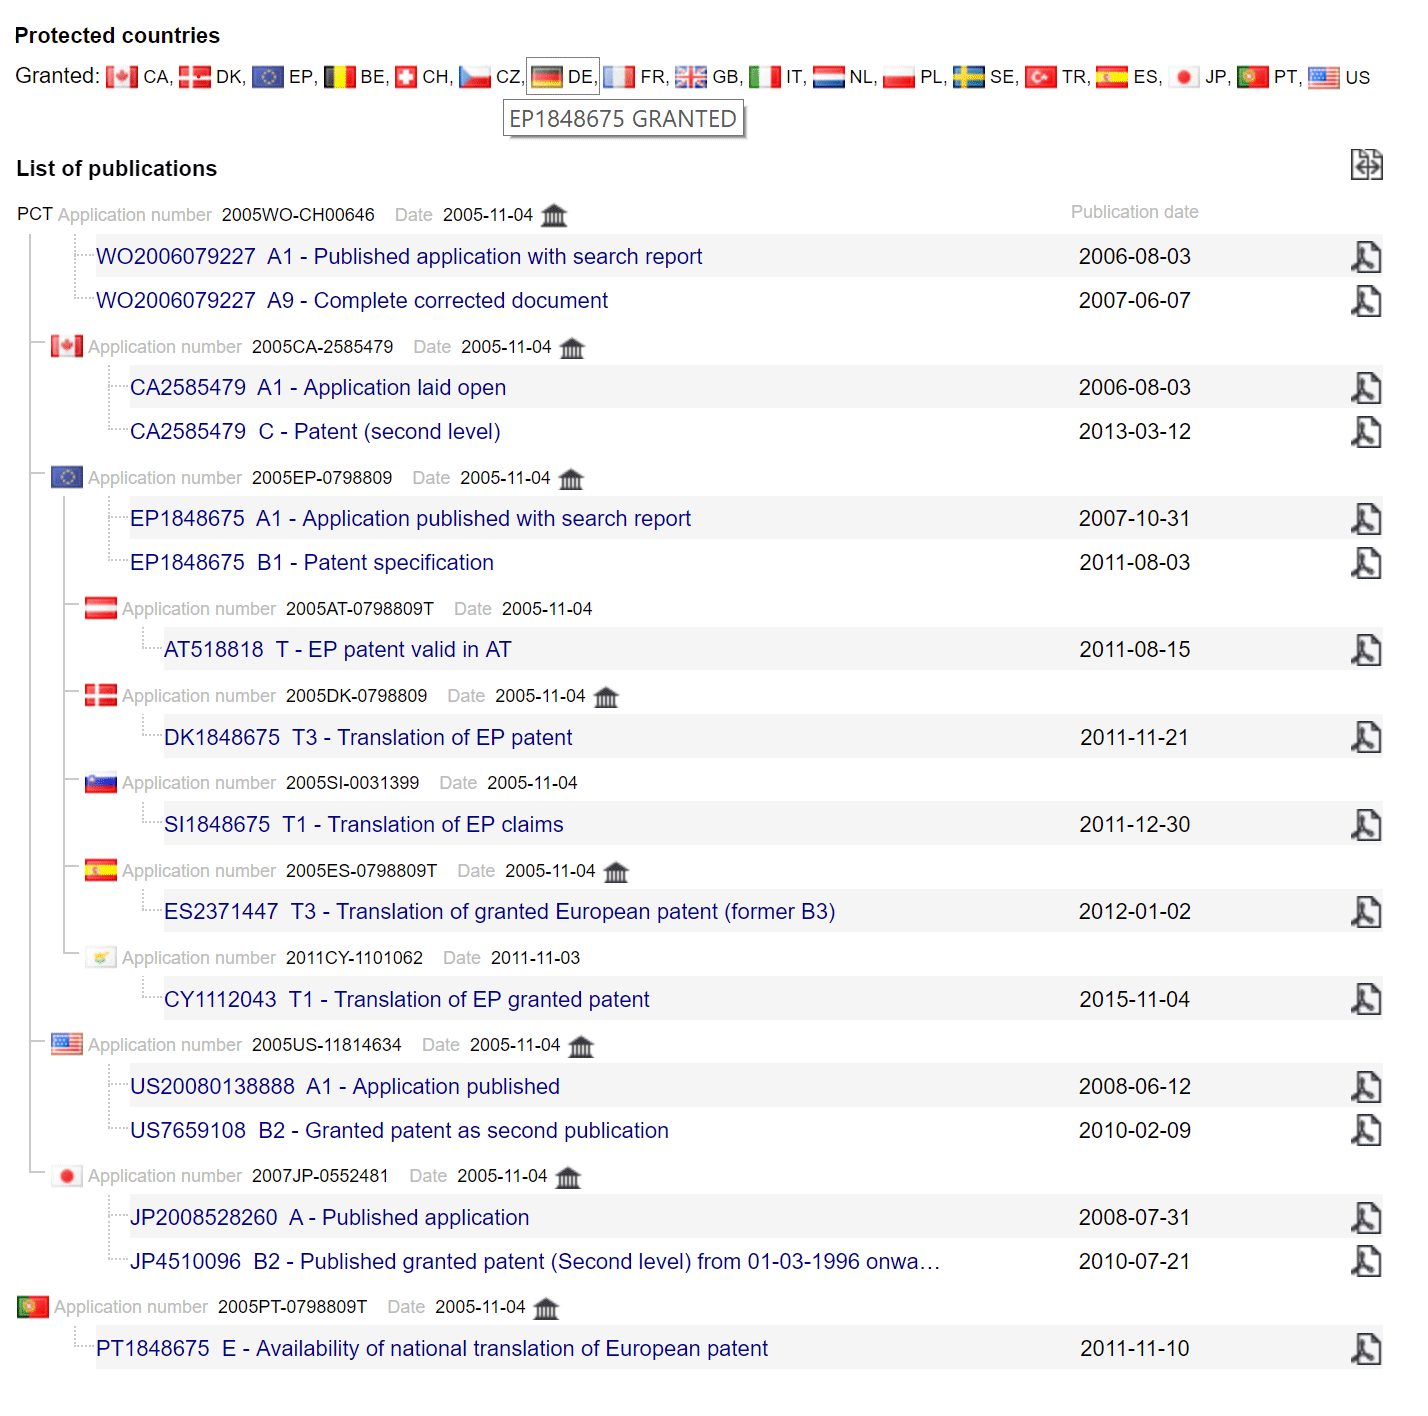
In the above example, the following countries where the invention is actually fully protected do not appear in the list of publications:
- Belgium (BE)
- Czech Republic (CZ)
- France (FR)
- Germany (DE)
- Great Britain (GB)
- Italy (IT)
- Poland (PL)
- Sweden (SE)
- Switzerland (CH)
- The Netherlands (NL)
- Turkey (TR)
The new “Protected Countries” field provides this critical piece of information at a glance, and when you mouse over each country’s flag you’ll see the list of patent numbers which are associated with the patent rights in that country. There can be multiple patent numbers per country; for instance there might be a national patent and European patent or just simply multiple national patent covering the same country.
The Protected Countries field is available in the Biblio tab by default:
The Protected Countries field can also be displayed in the Preview tab. To select it, use the Edit Preview button and add the field to the list of fields to display:
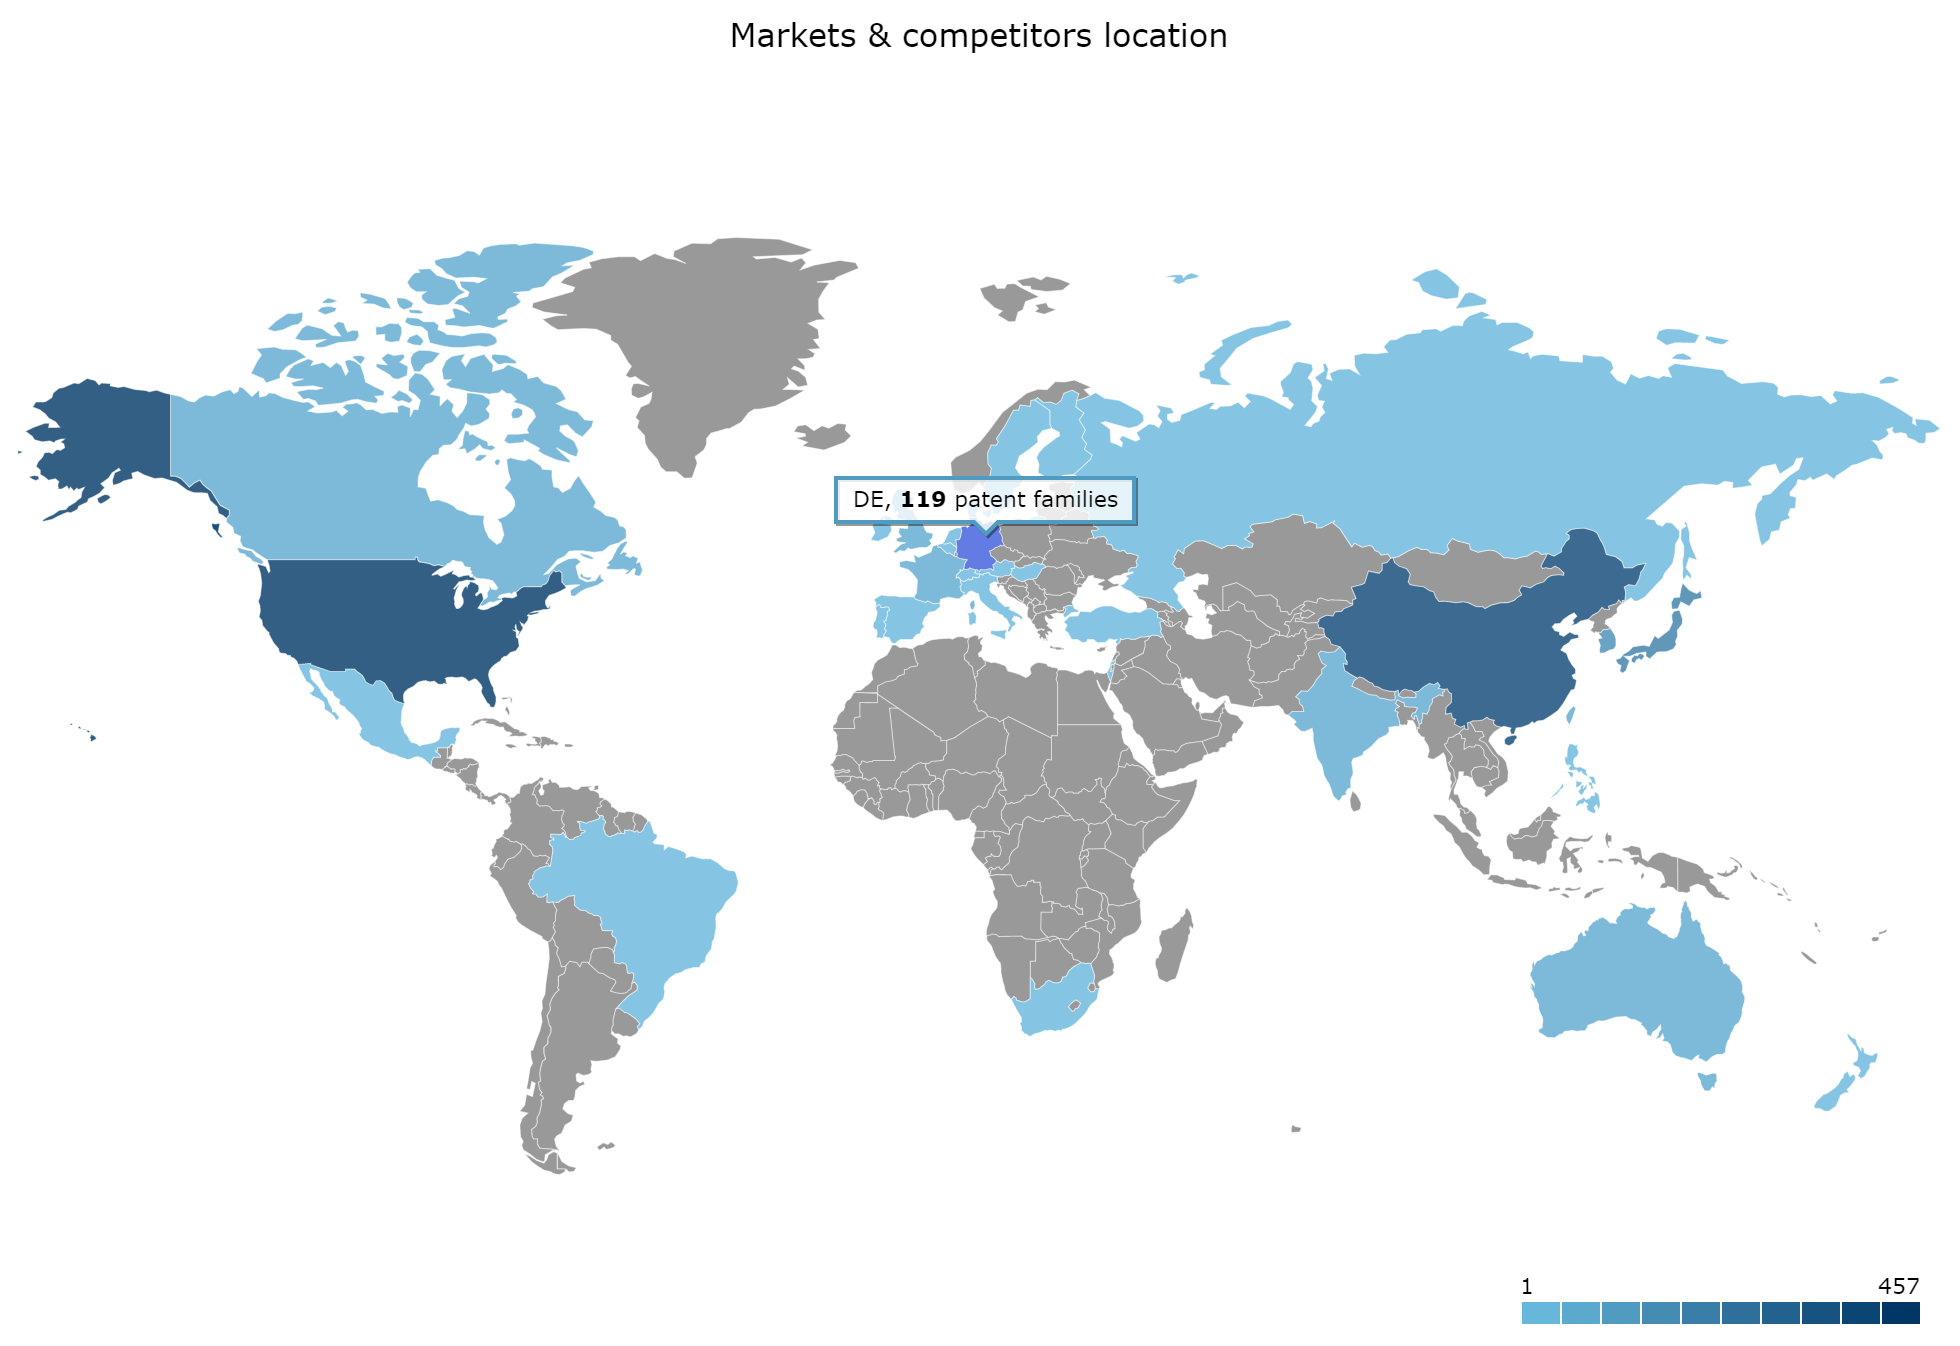
Analyze your market without bias
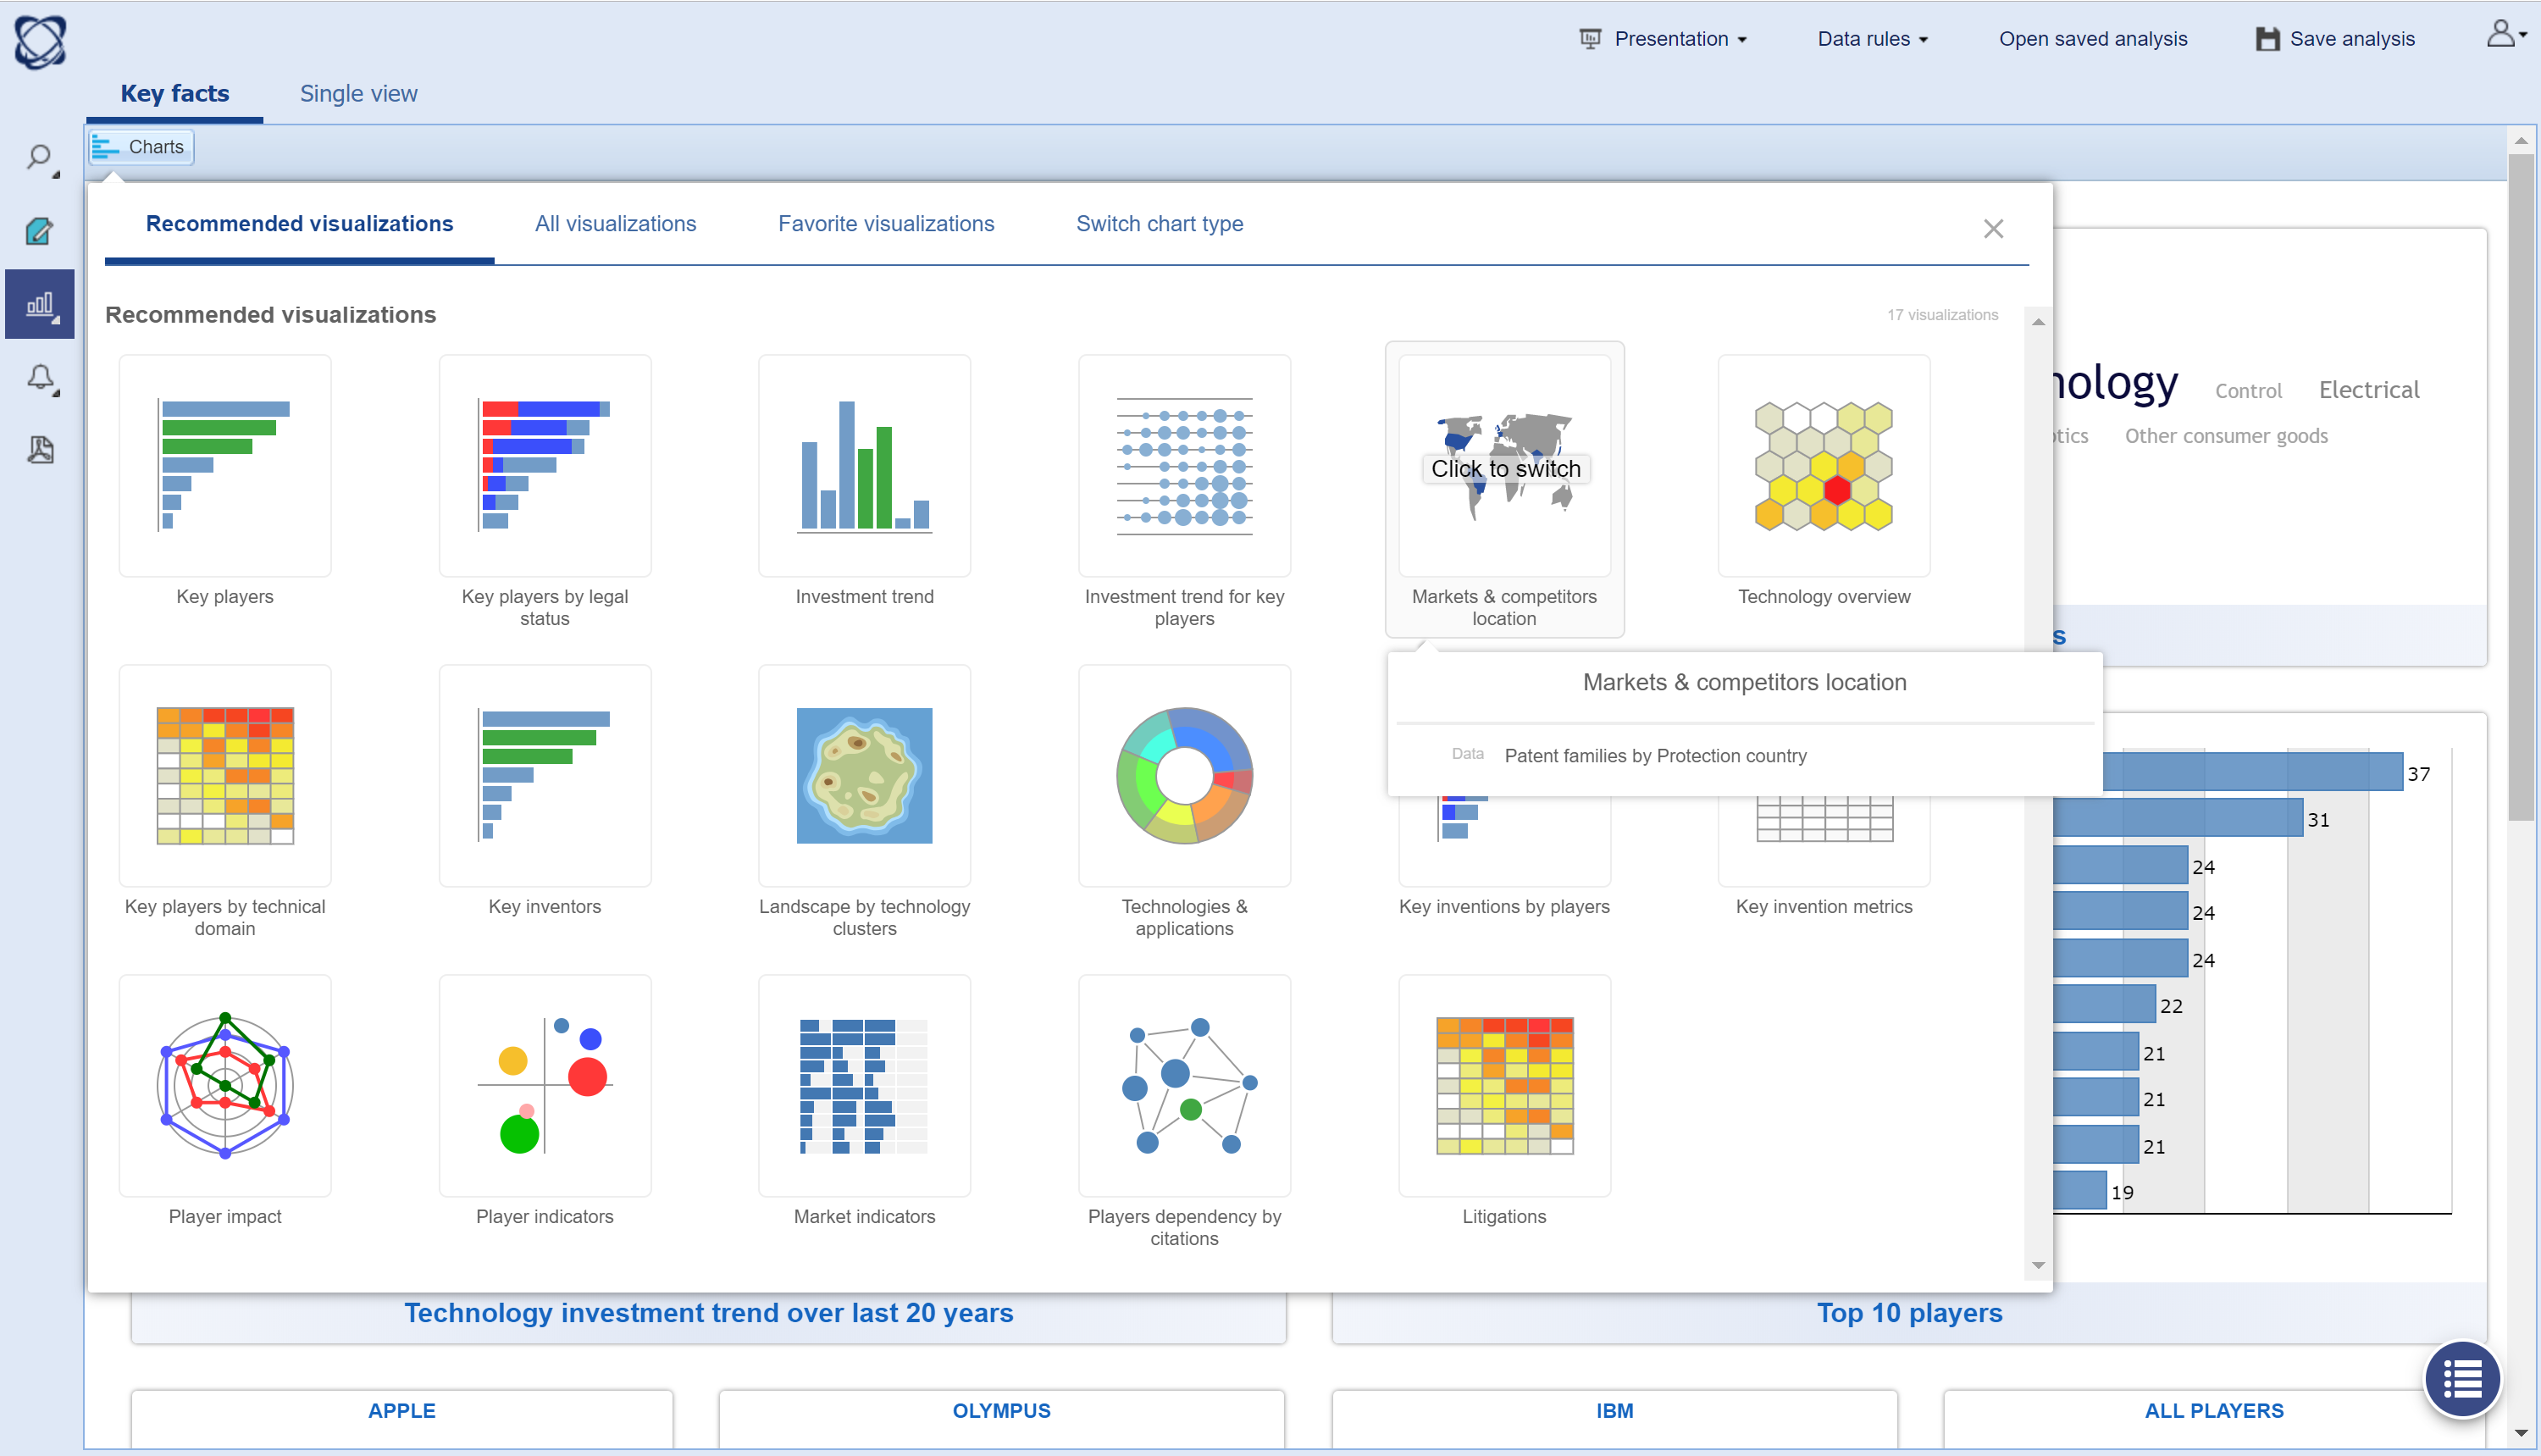
Orbit Intelligence also allows you to analyze by protection country.
To analyze by protection country, select the "Market & competitors location" graph from the Recommended visualizations menu or select the field from the Settings menu.